Skills
Infographics & Data Visualization
One of the most interesting tasks as a designer is distilling complex information into more understandable forms. Many projects have required me to translate a data set into eye-catching graphics and apply them to marketing efforts.
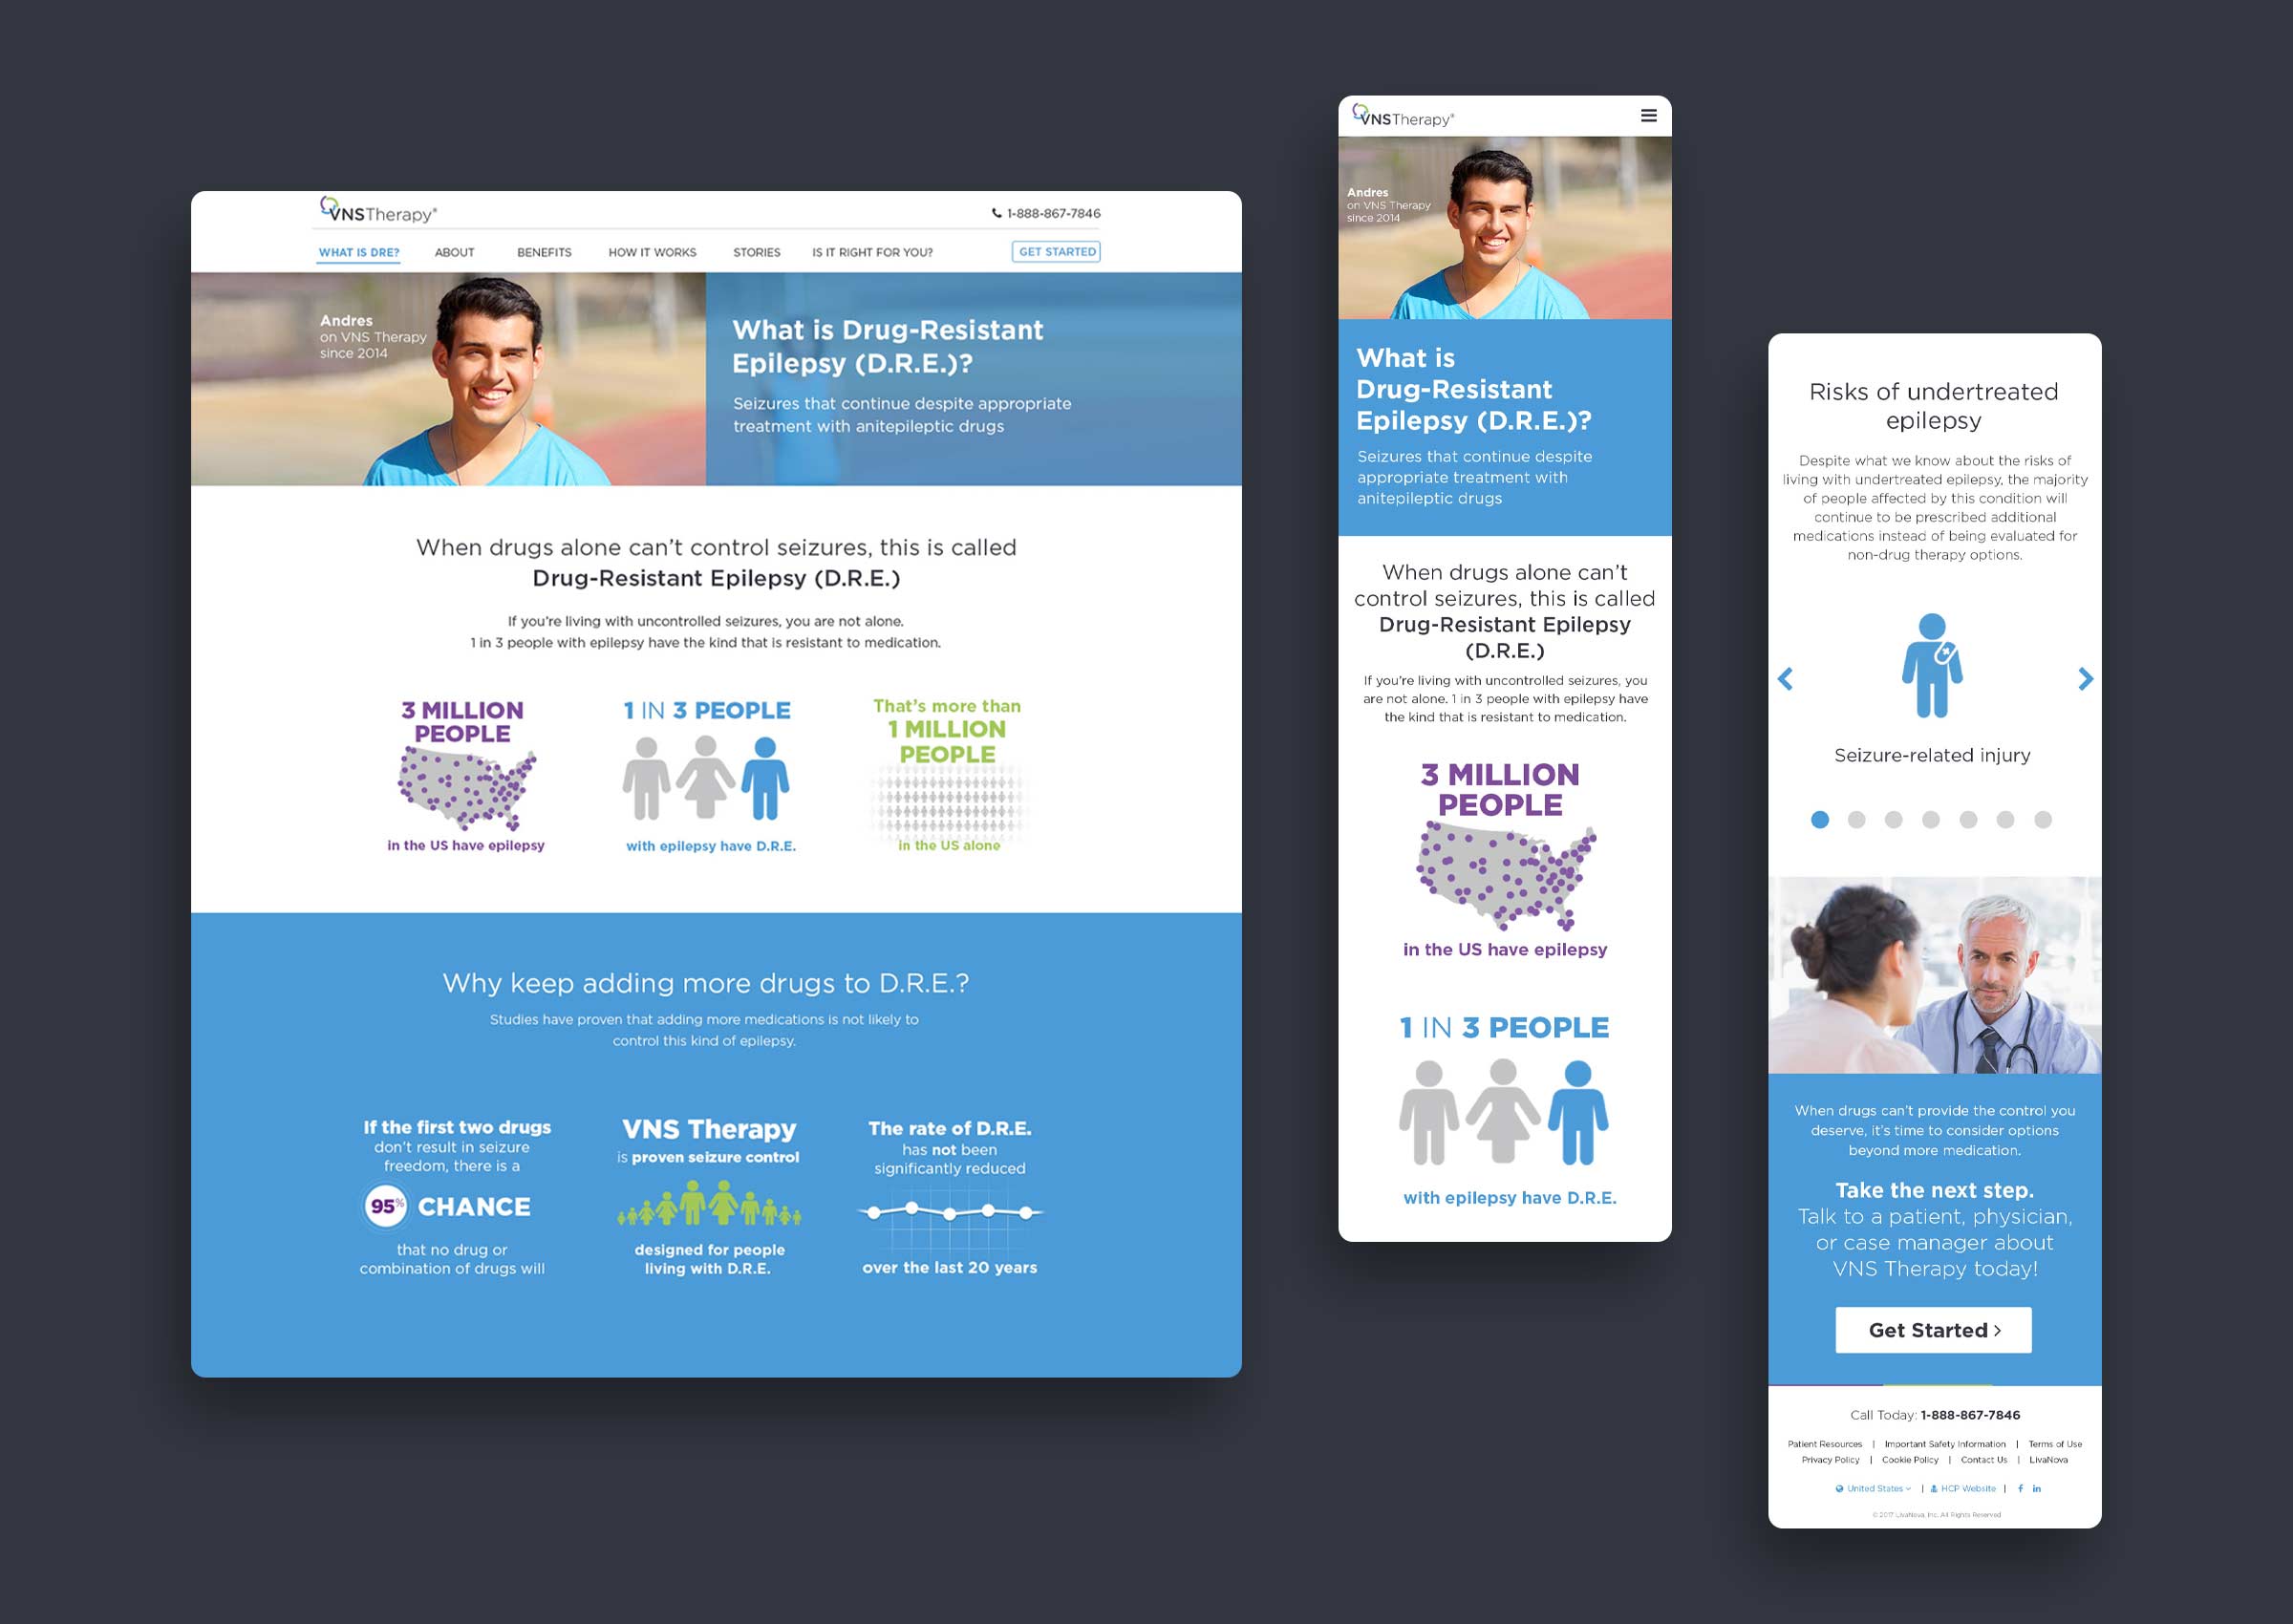
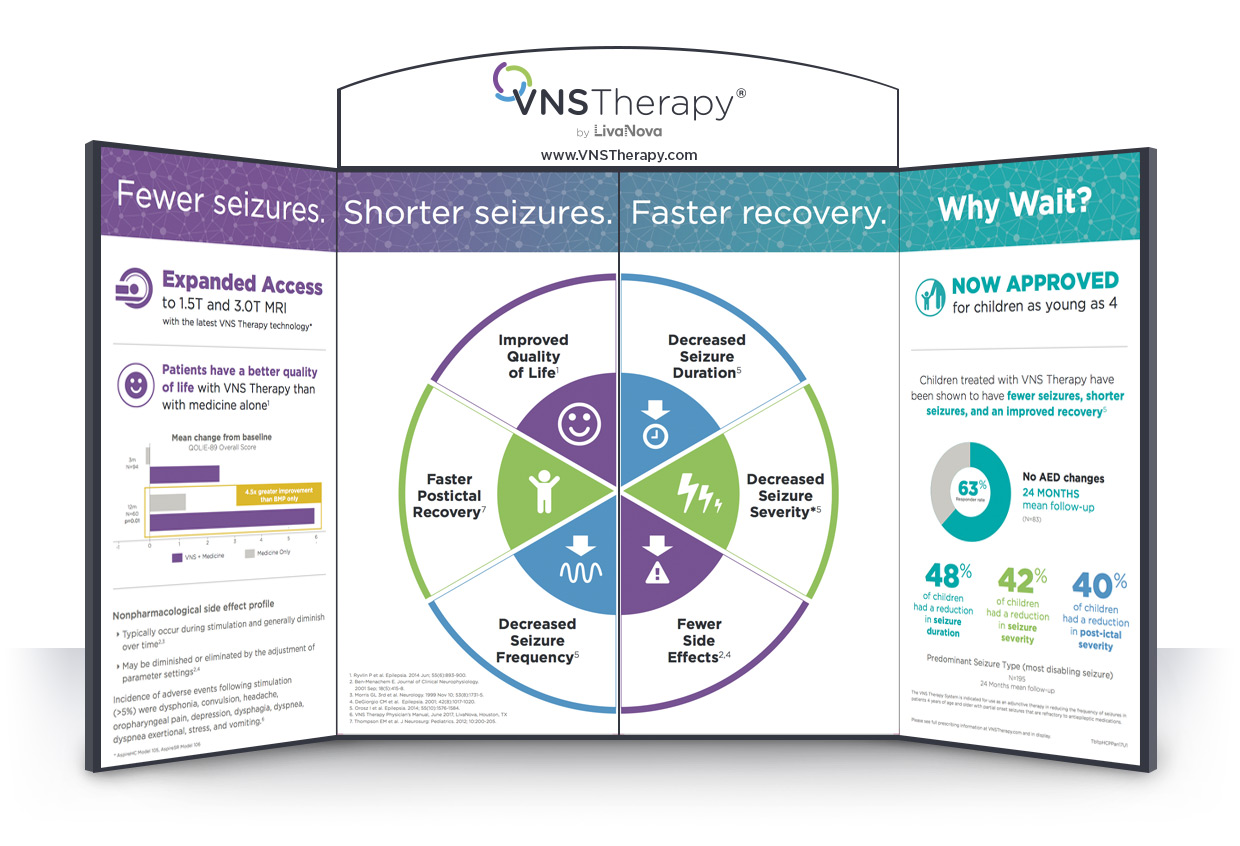
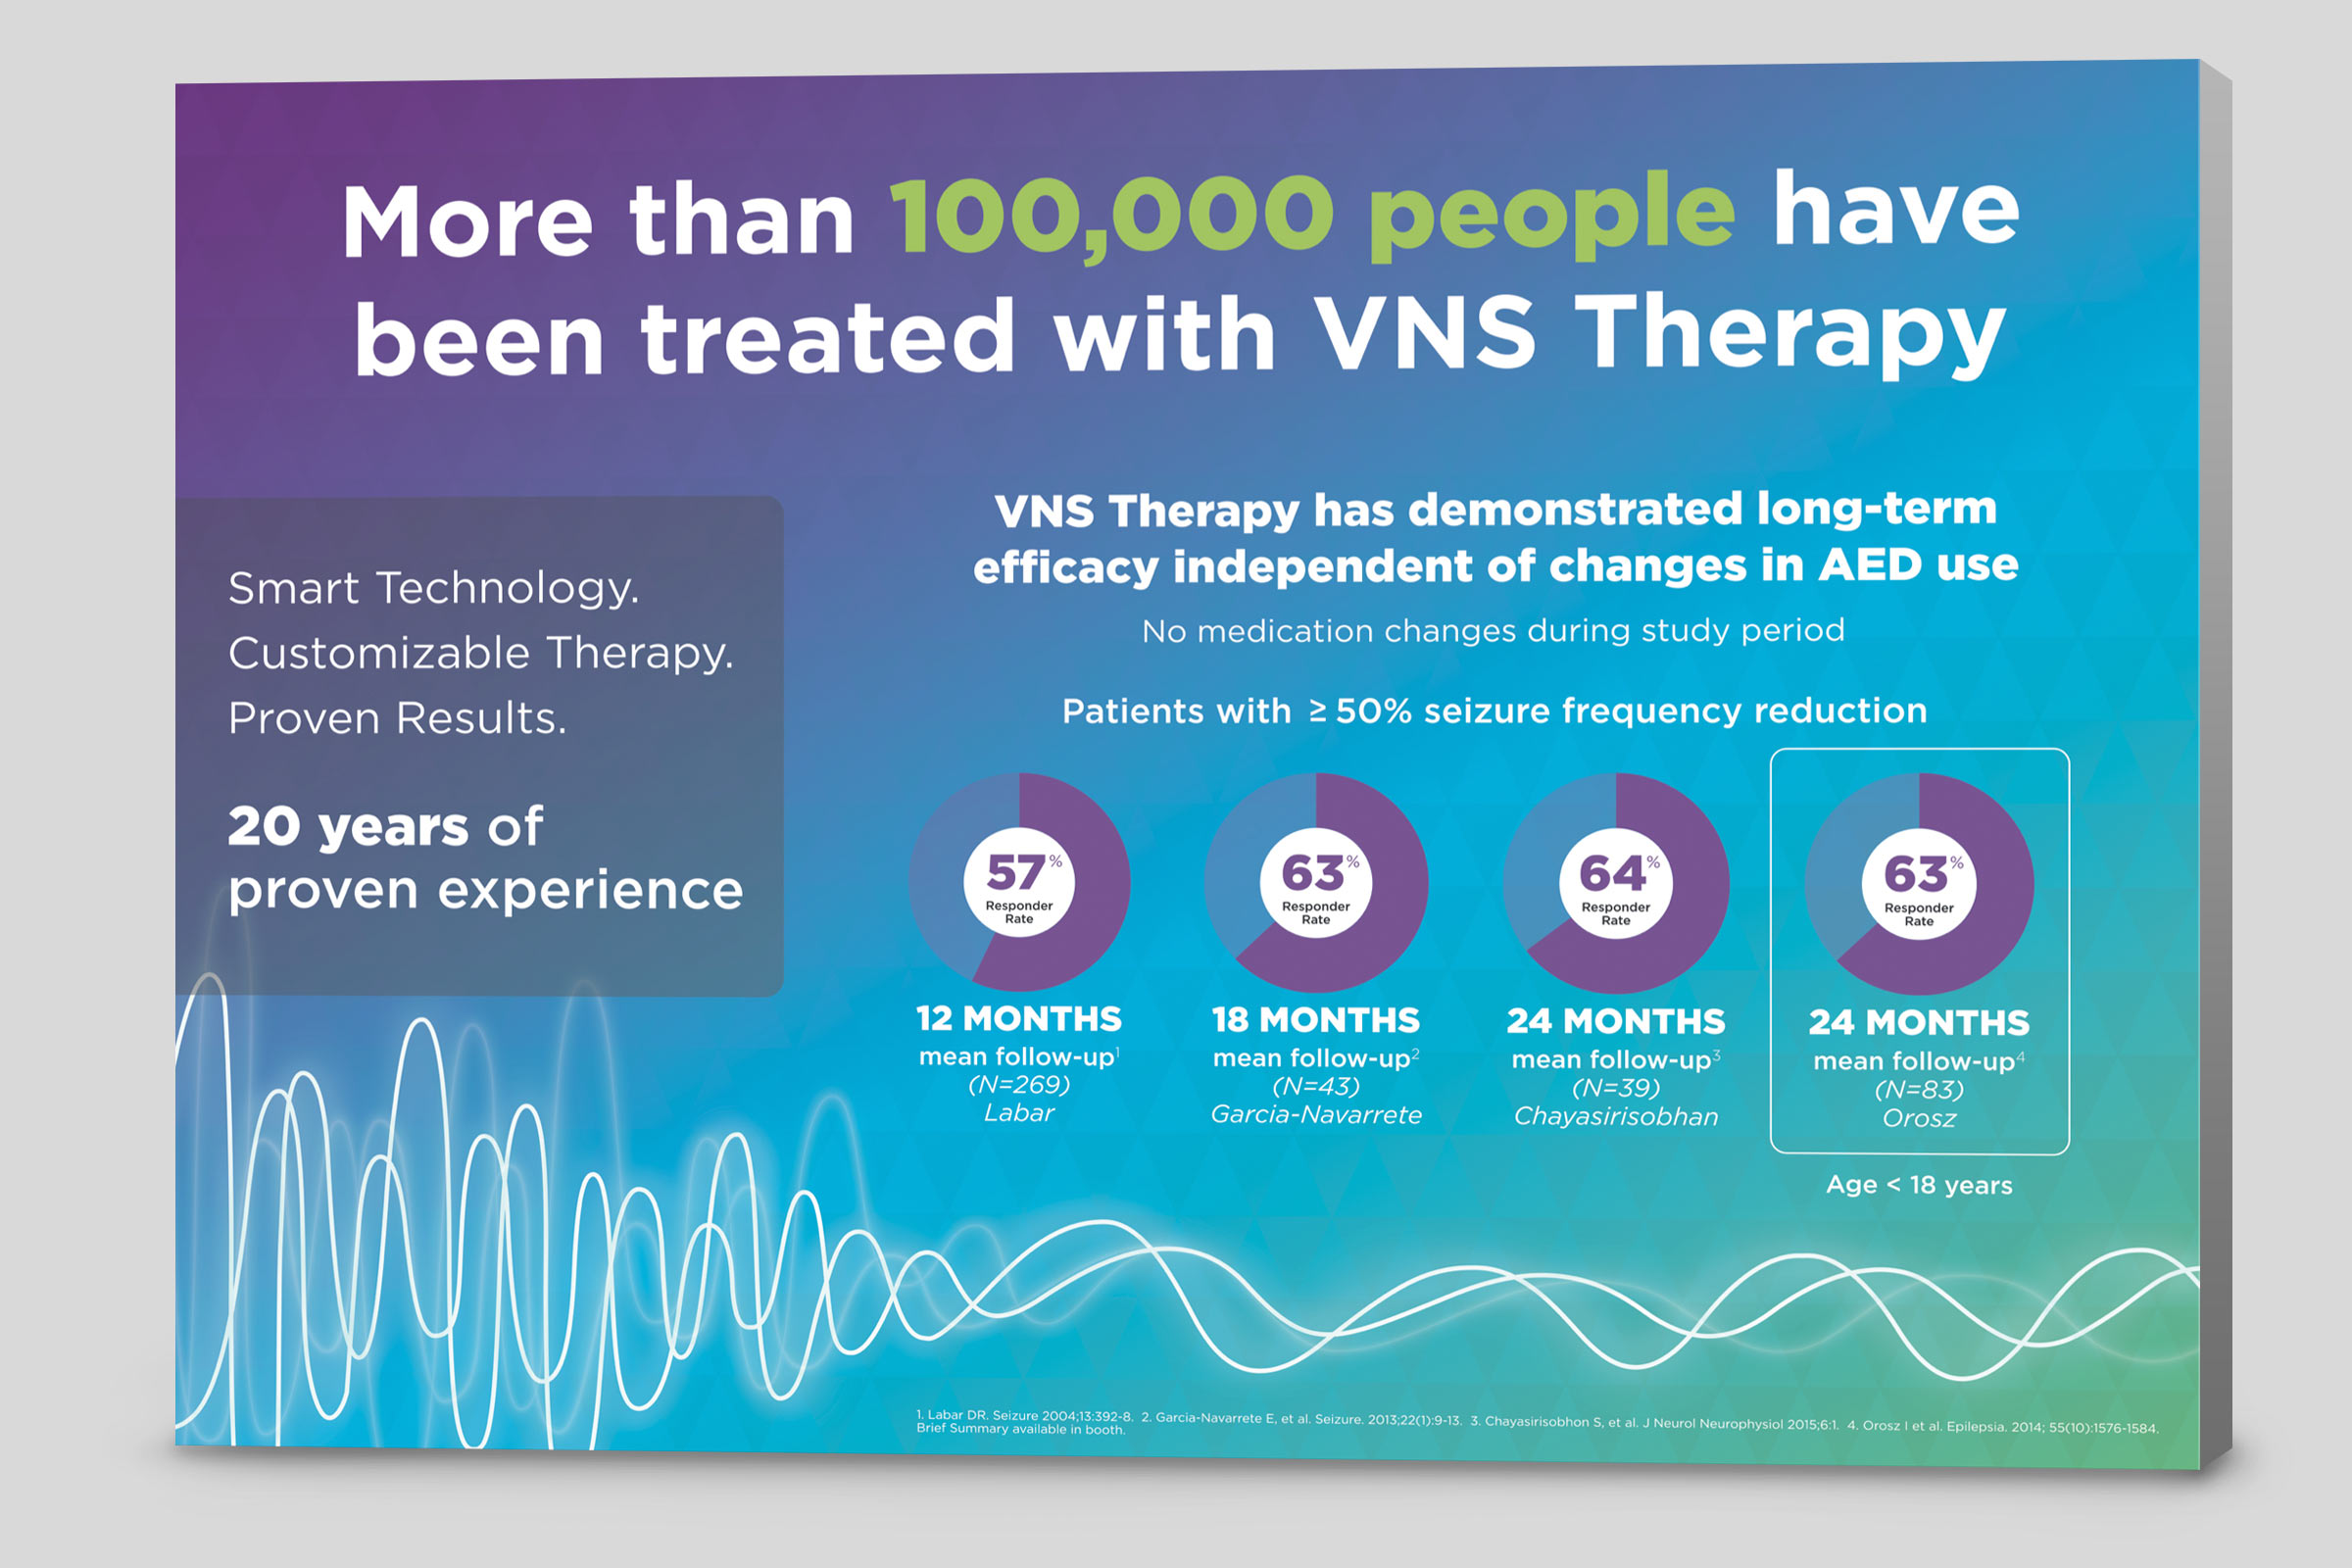
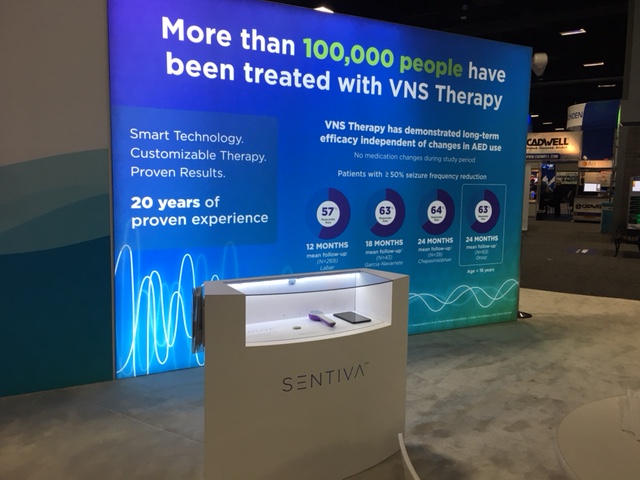
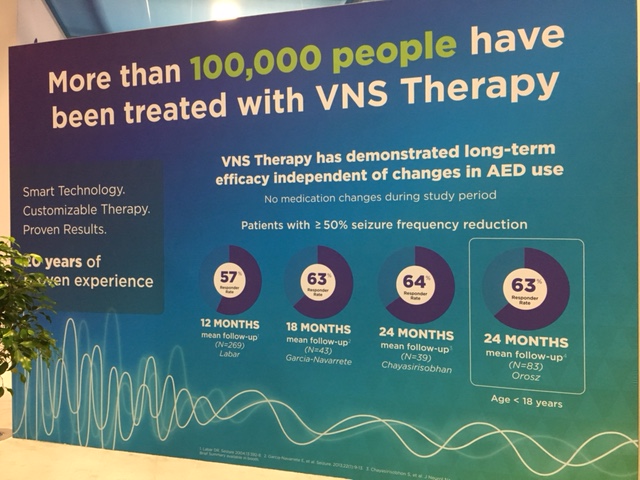
VNS Therapy
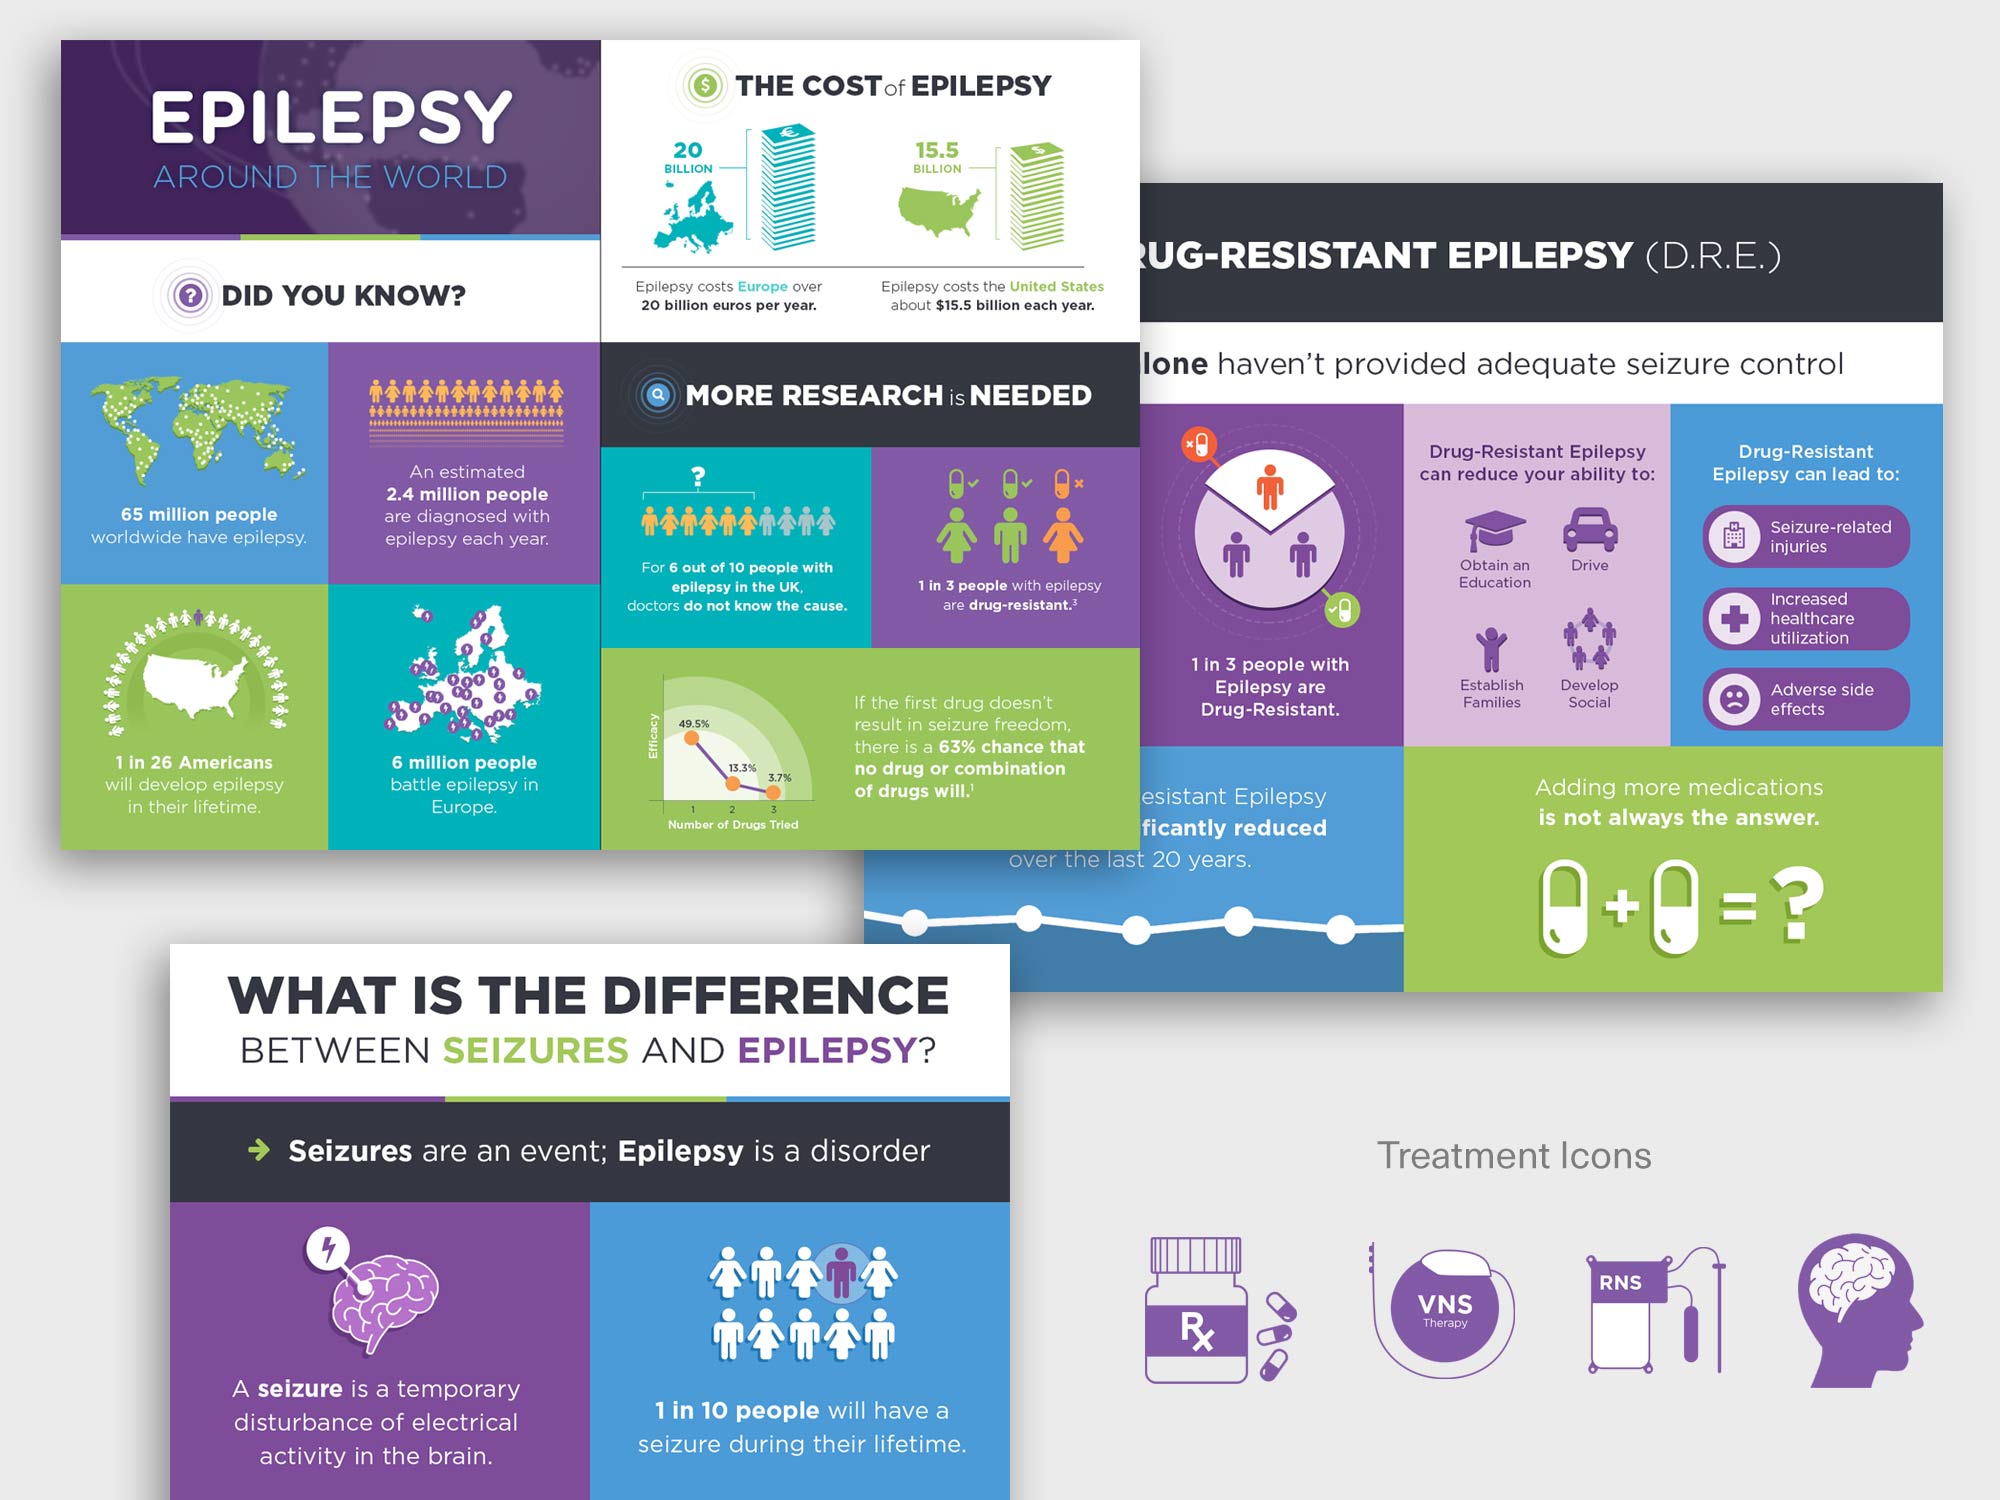
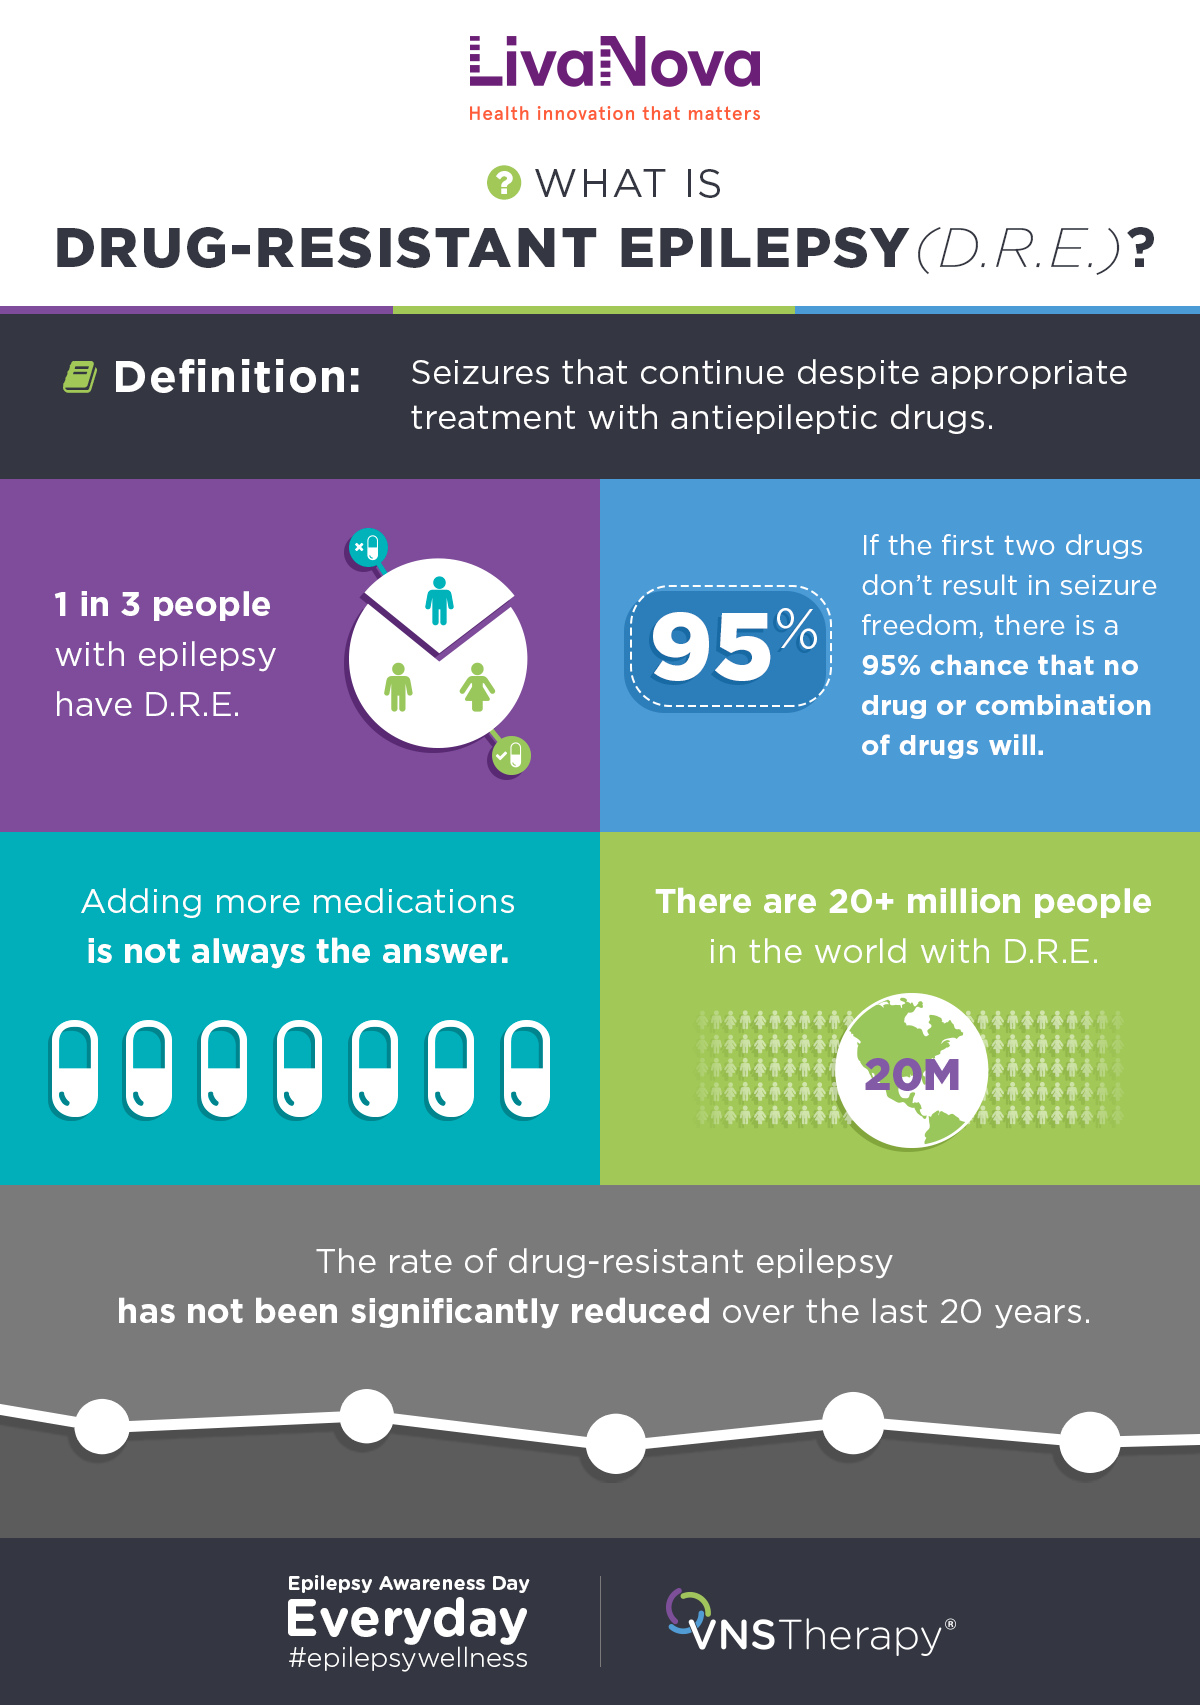
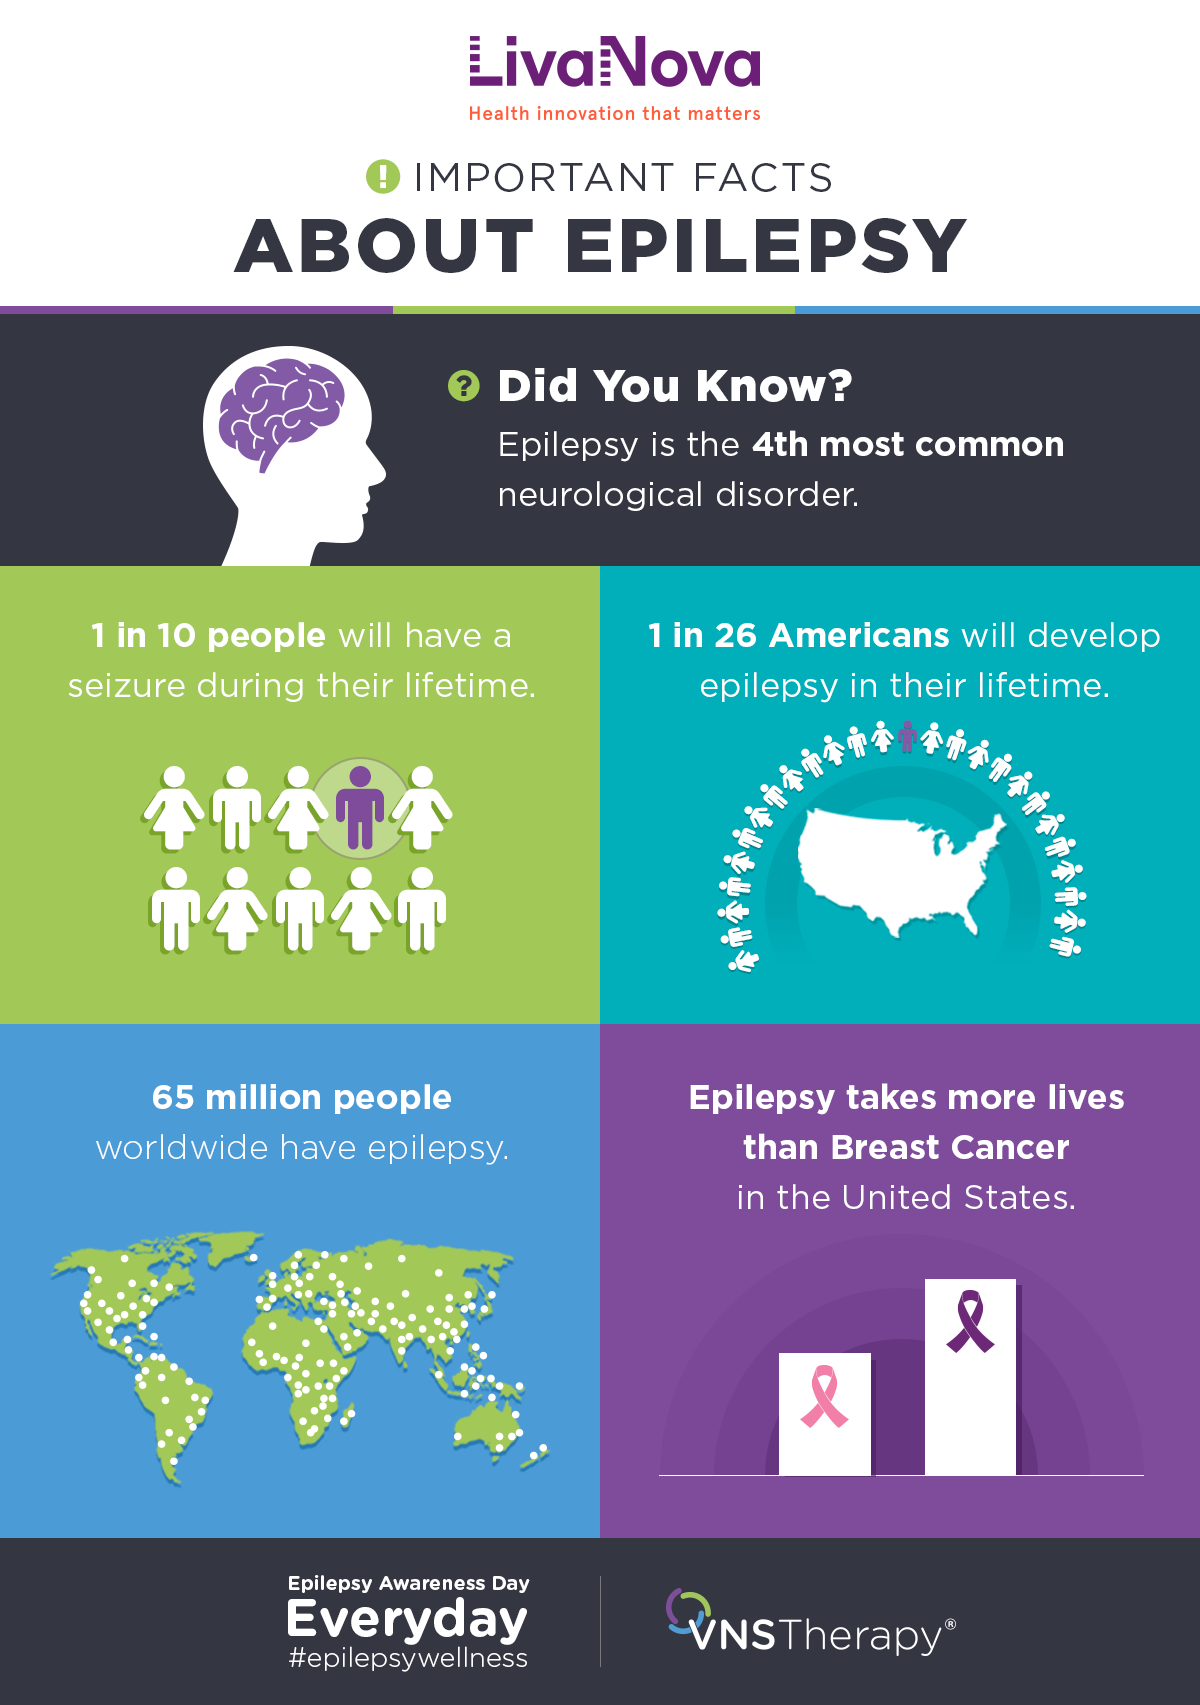
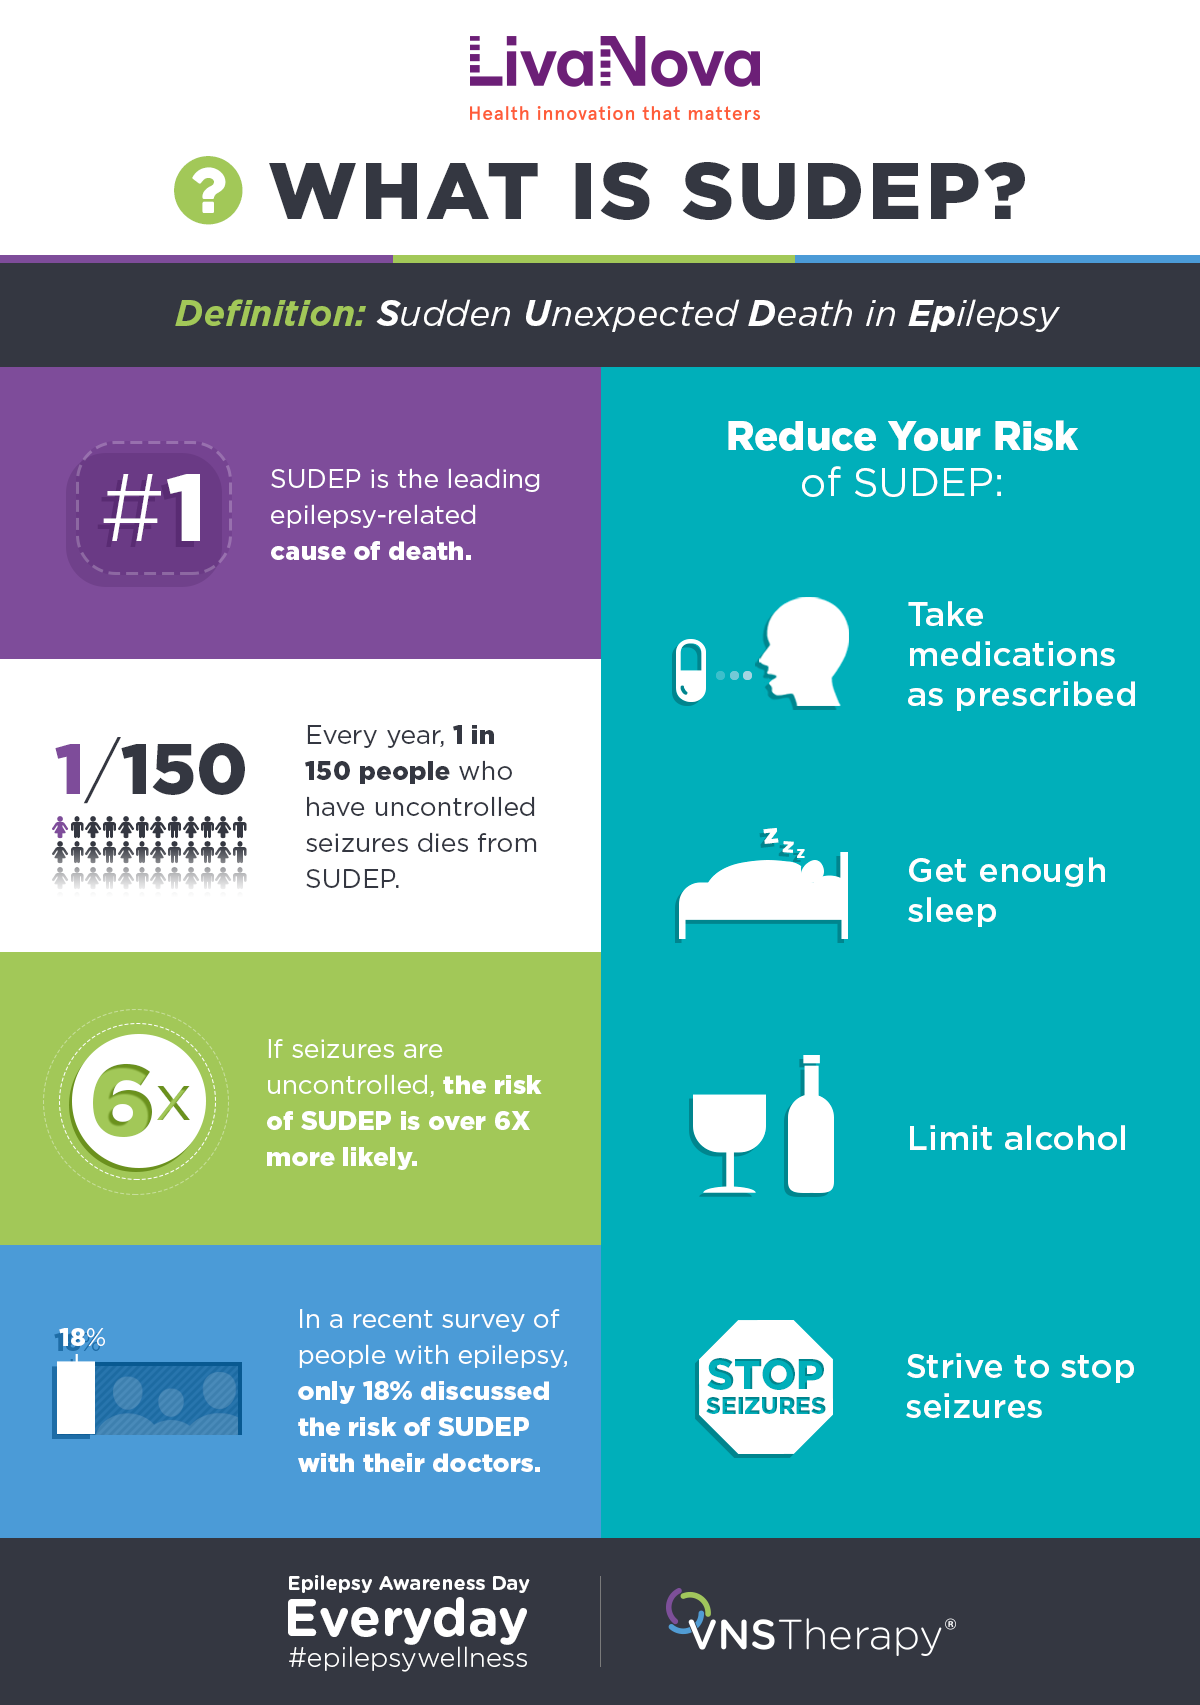
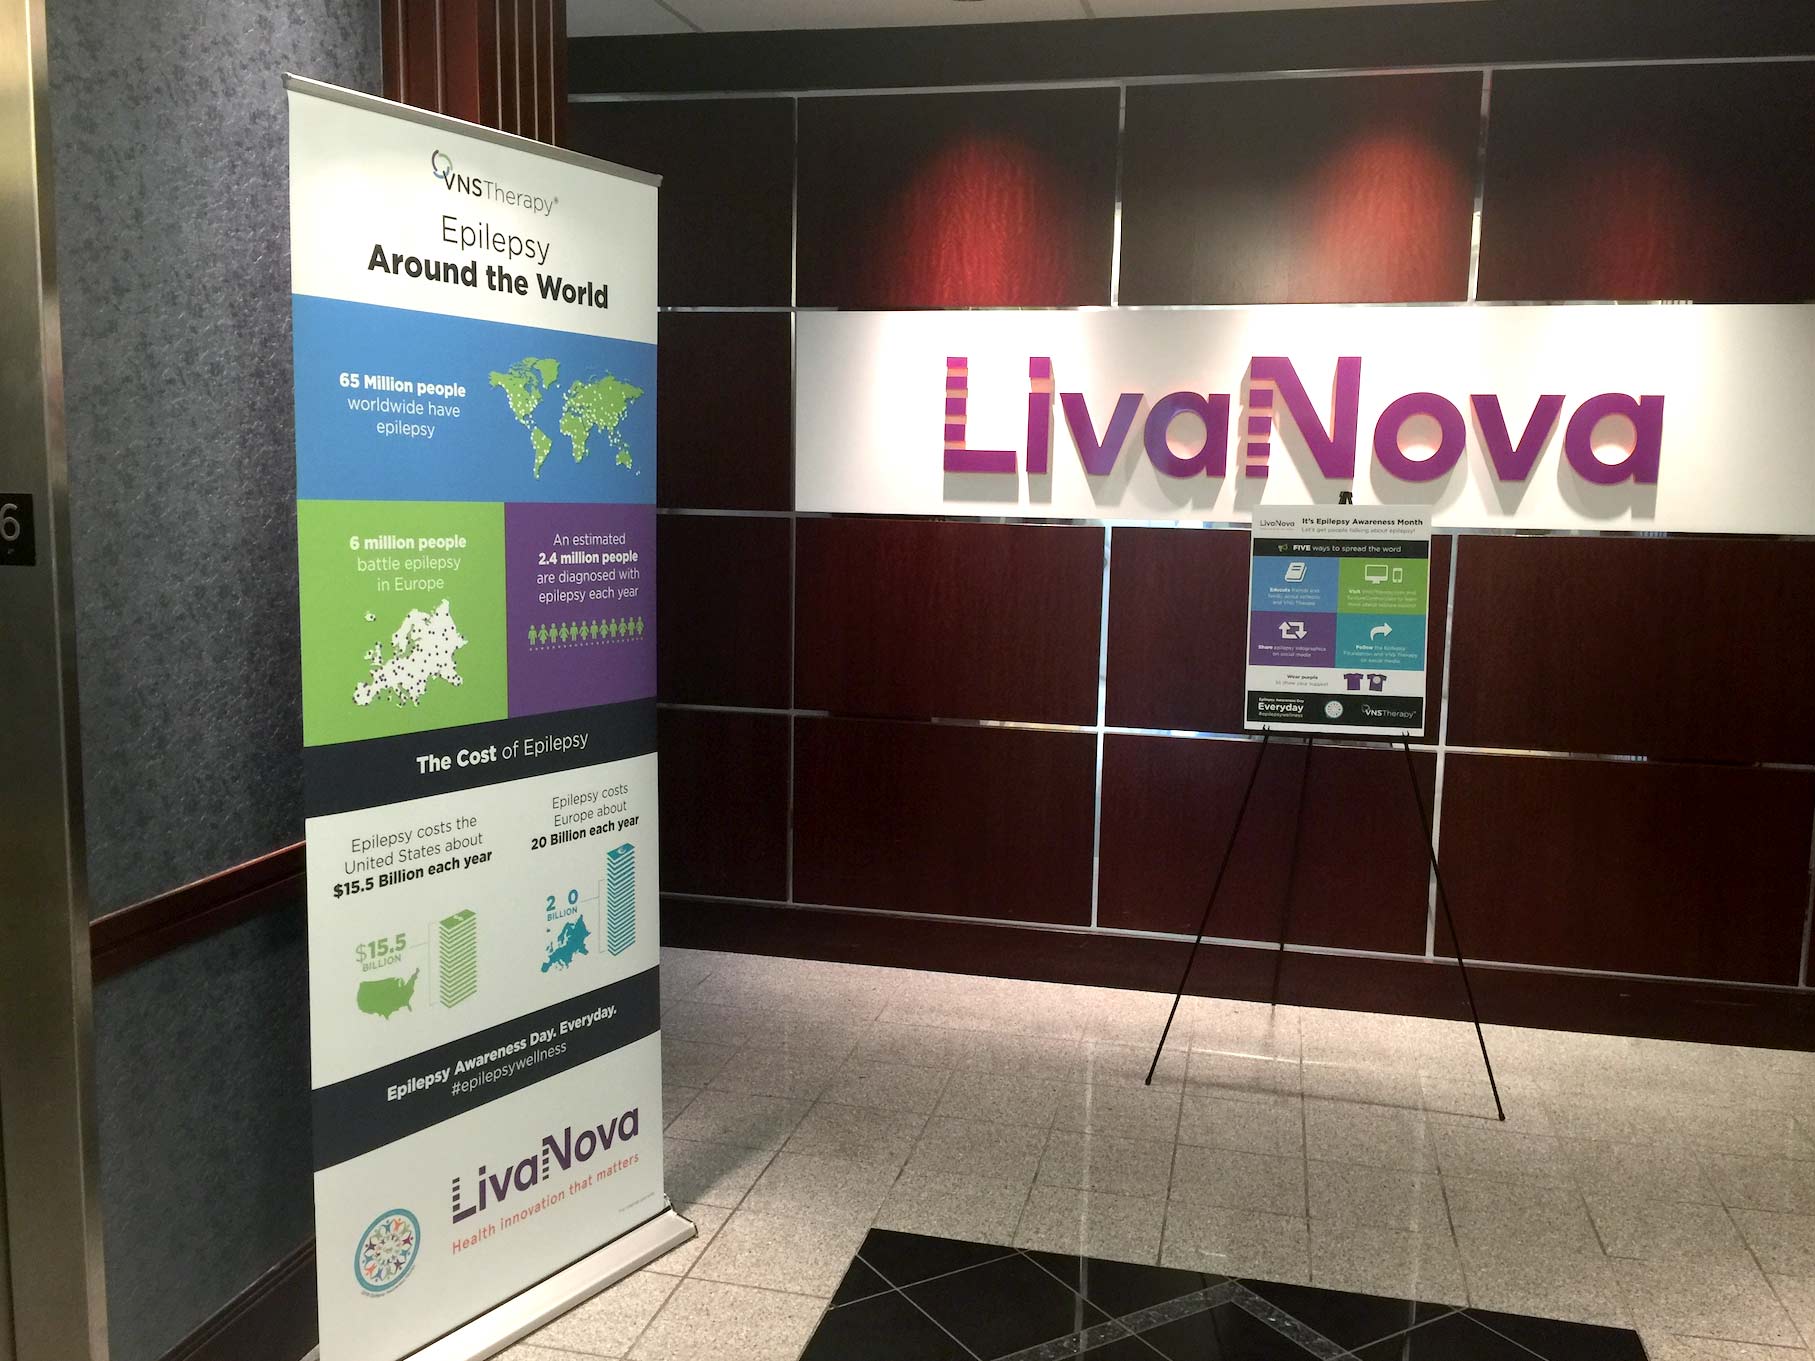
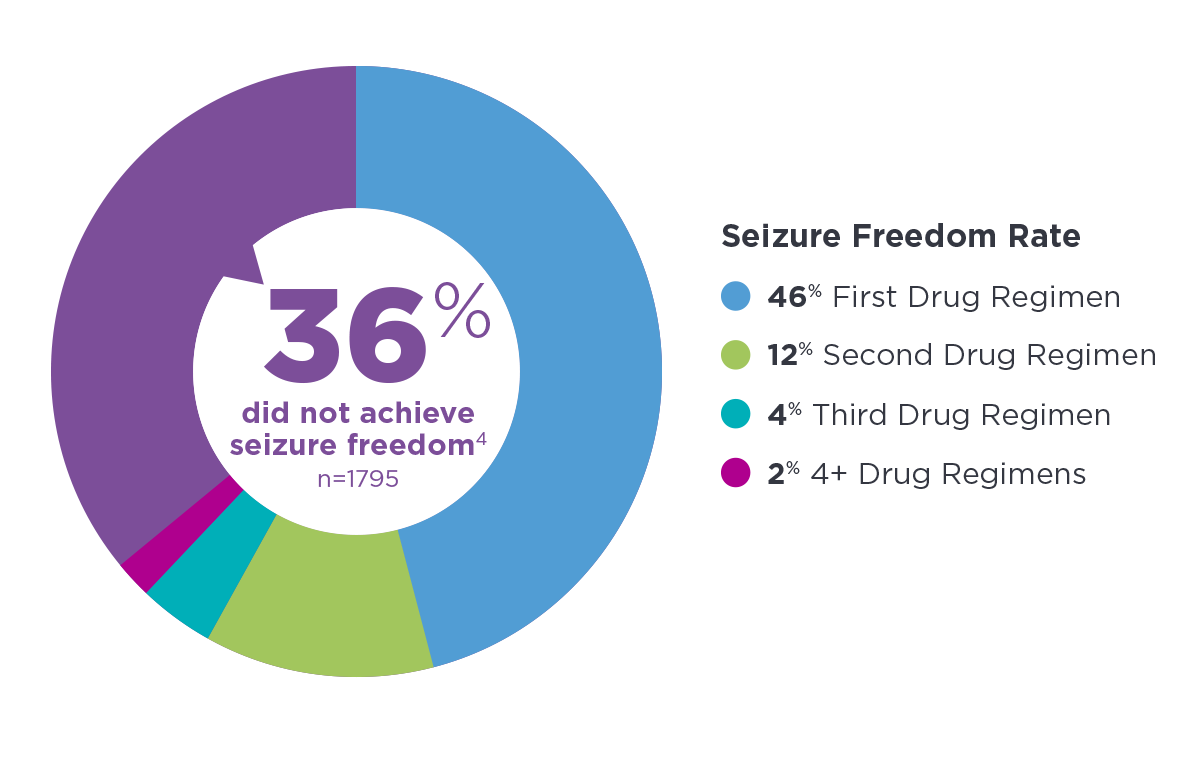
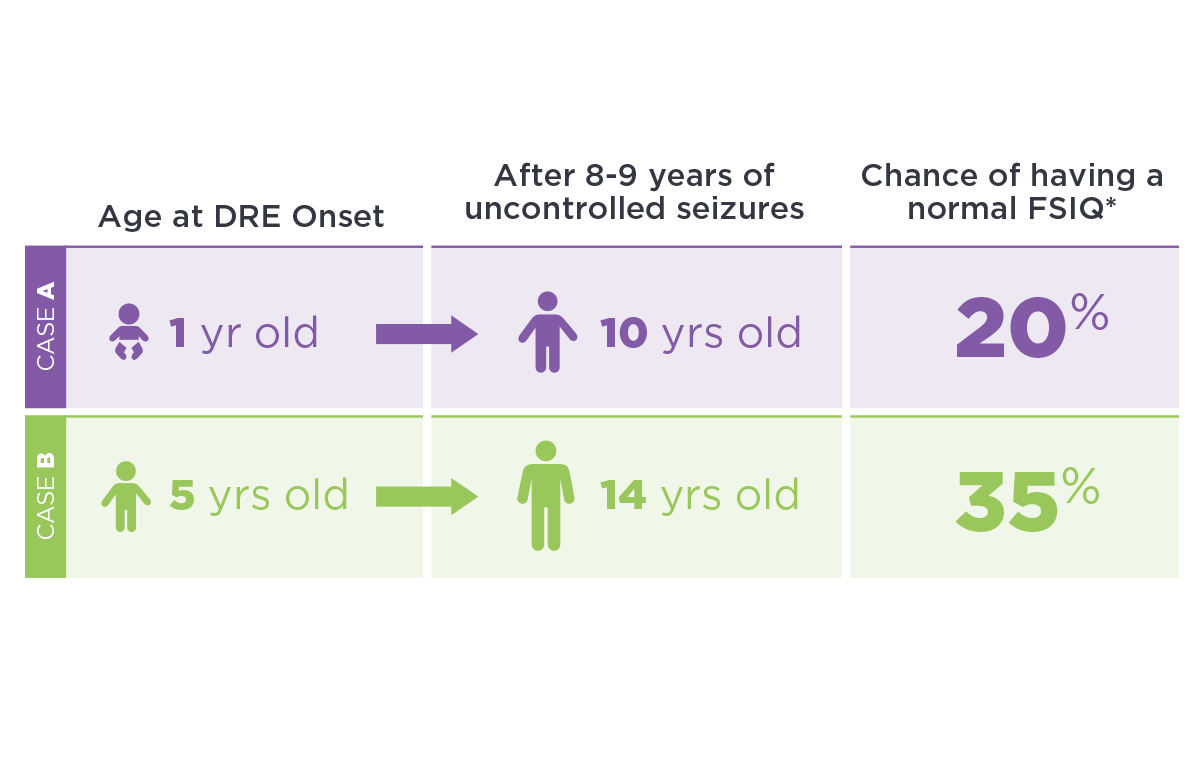
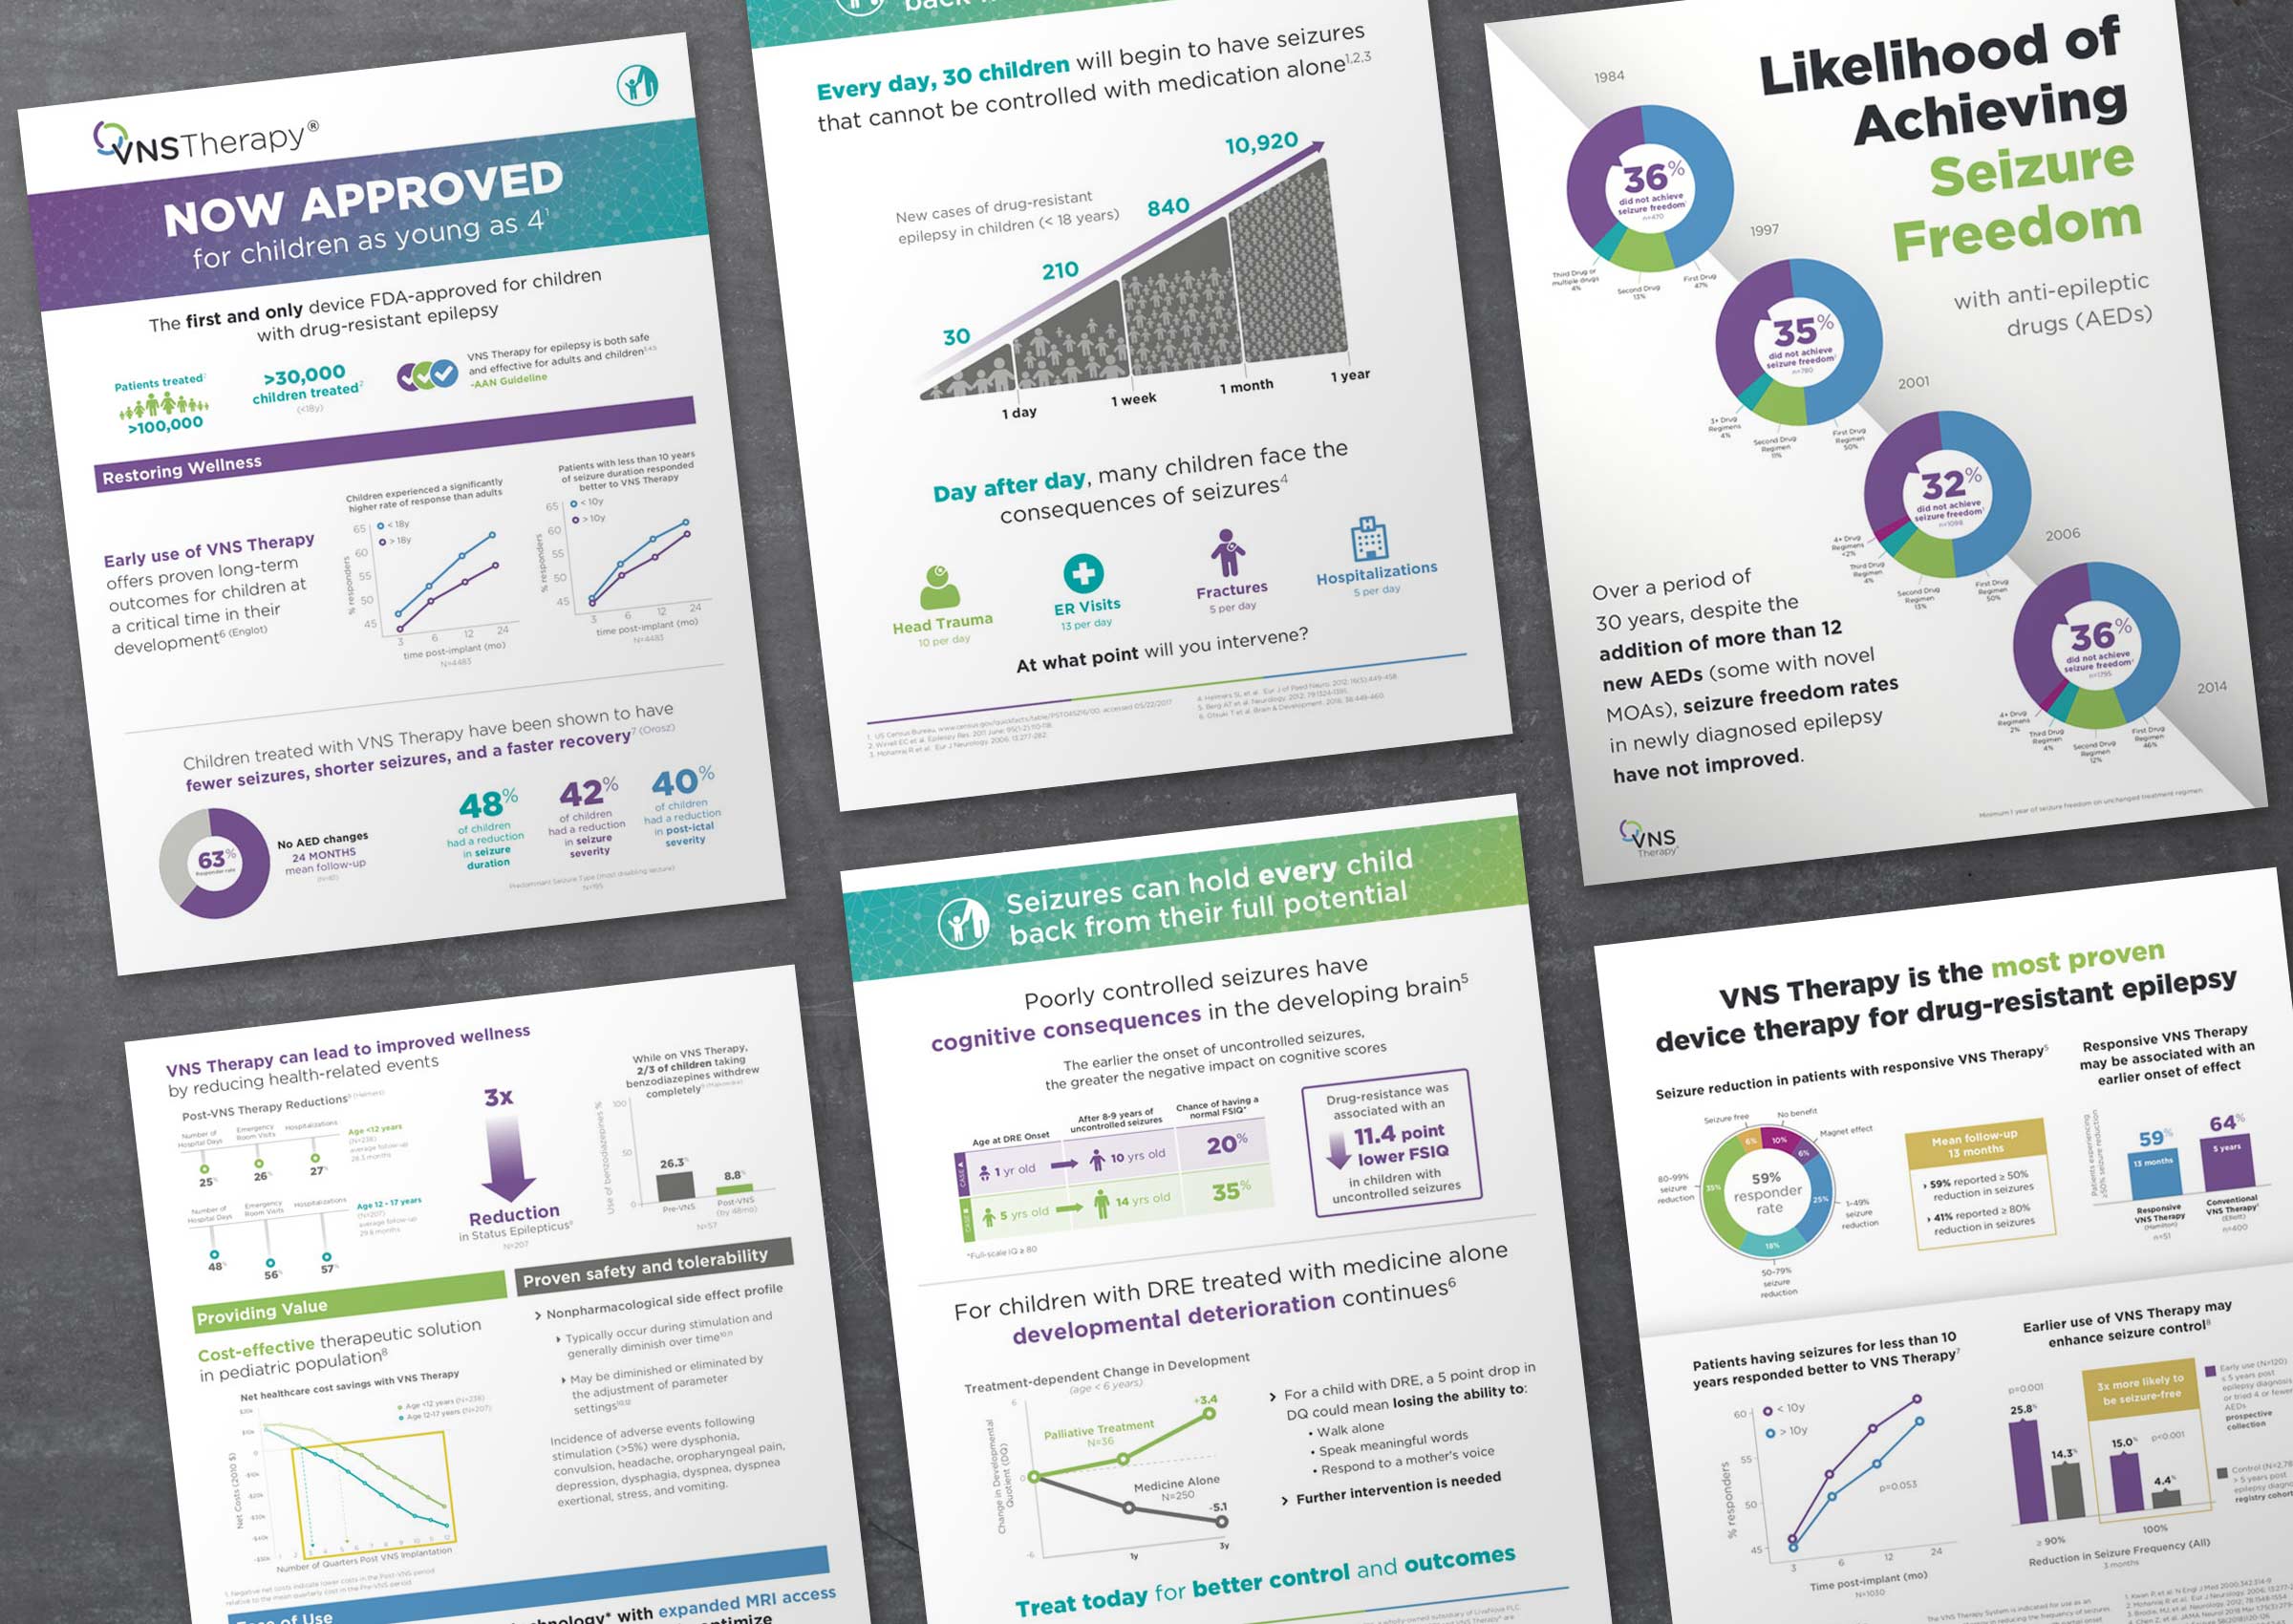
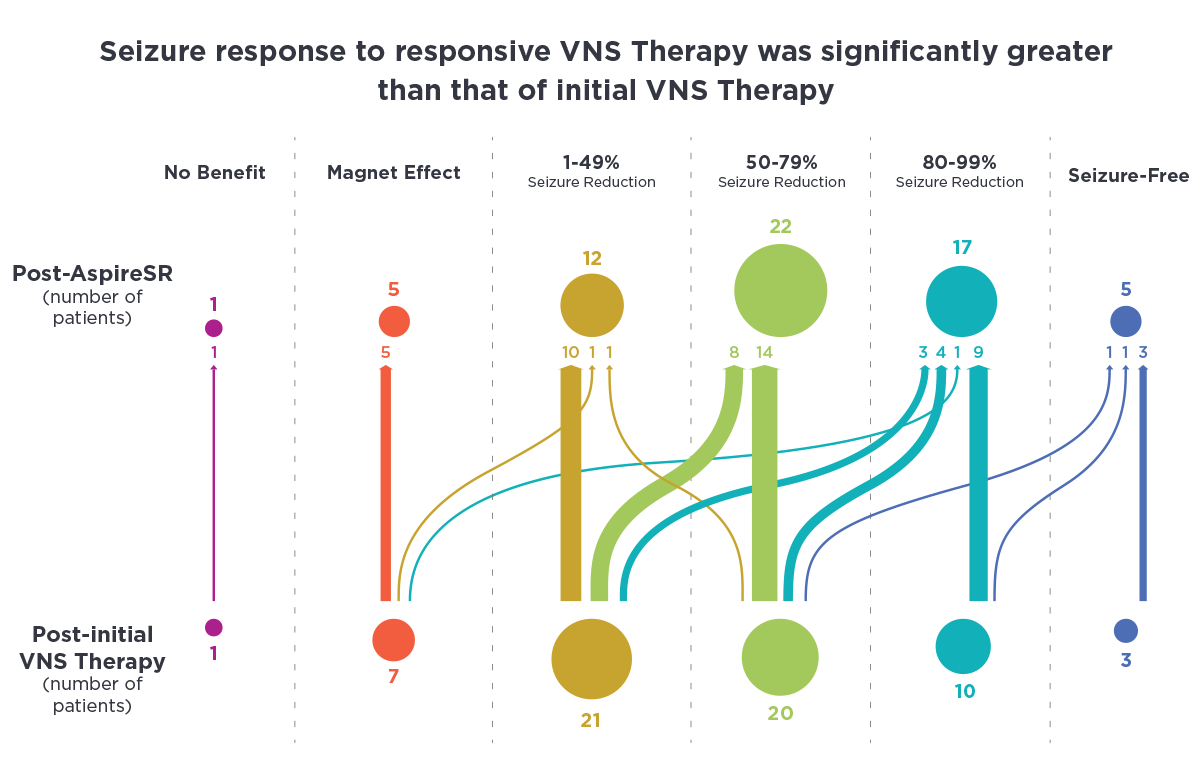
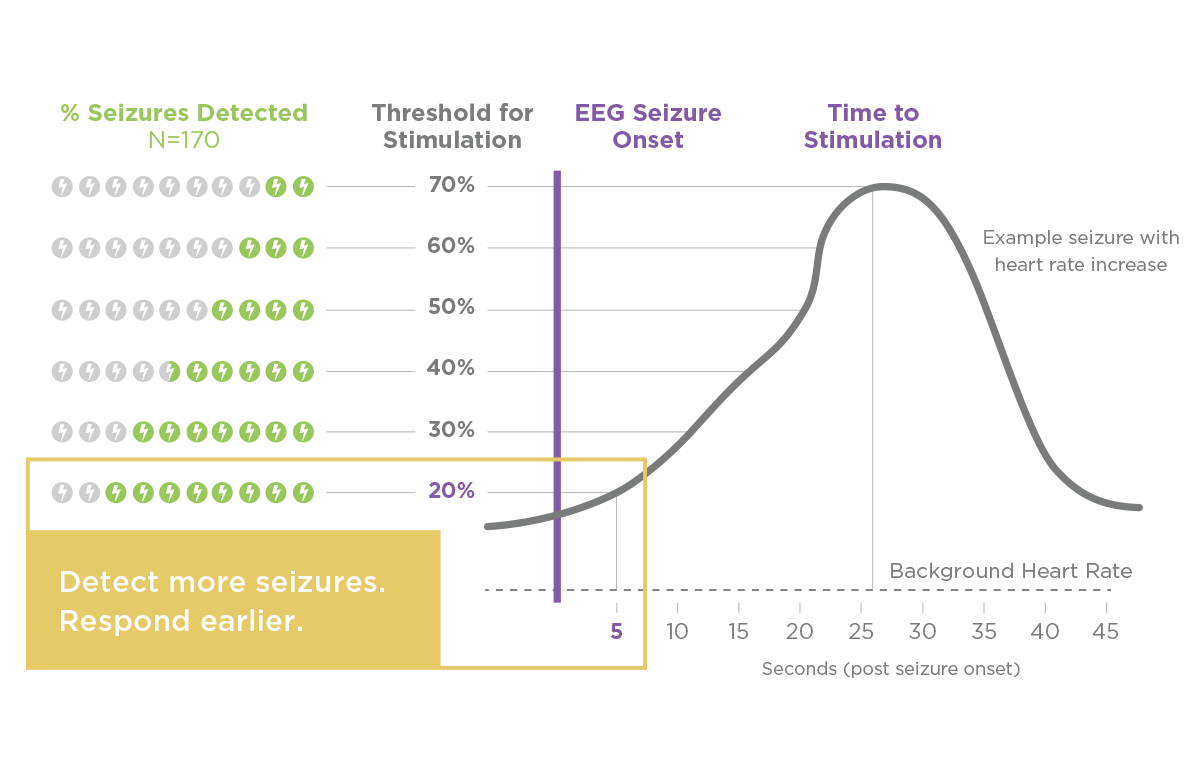
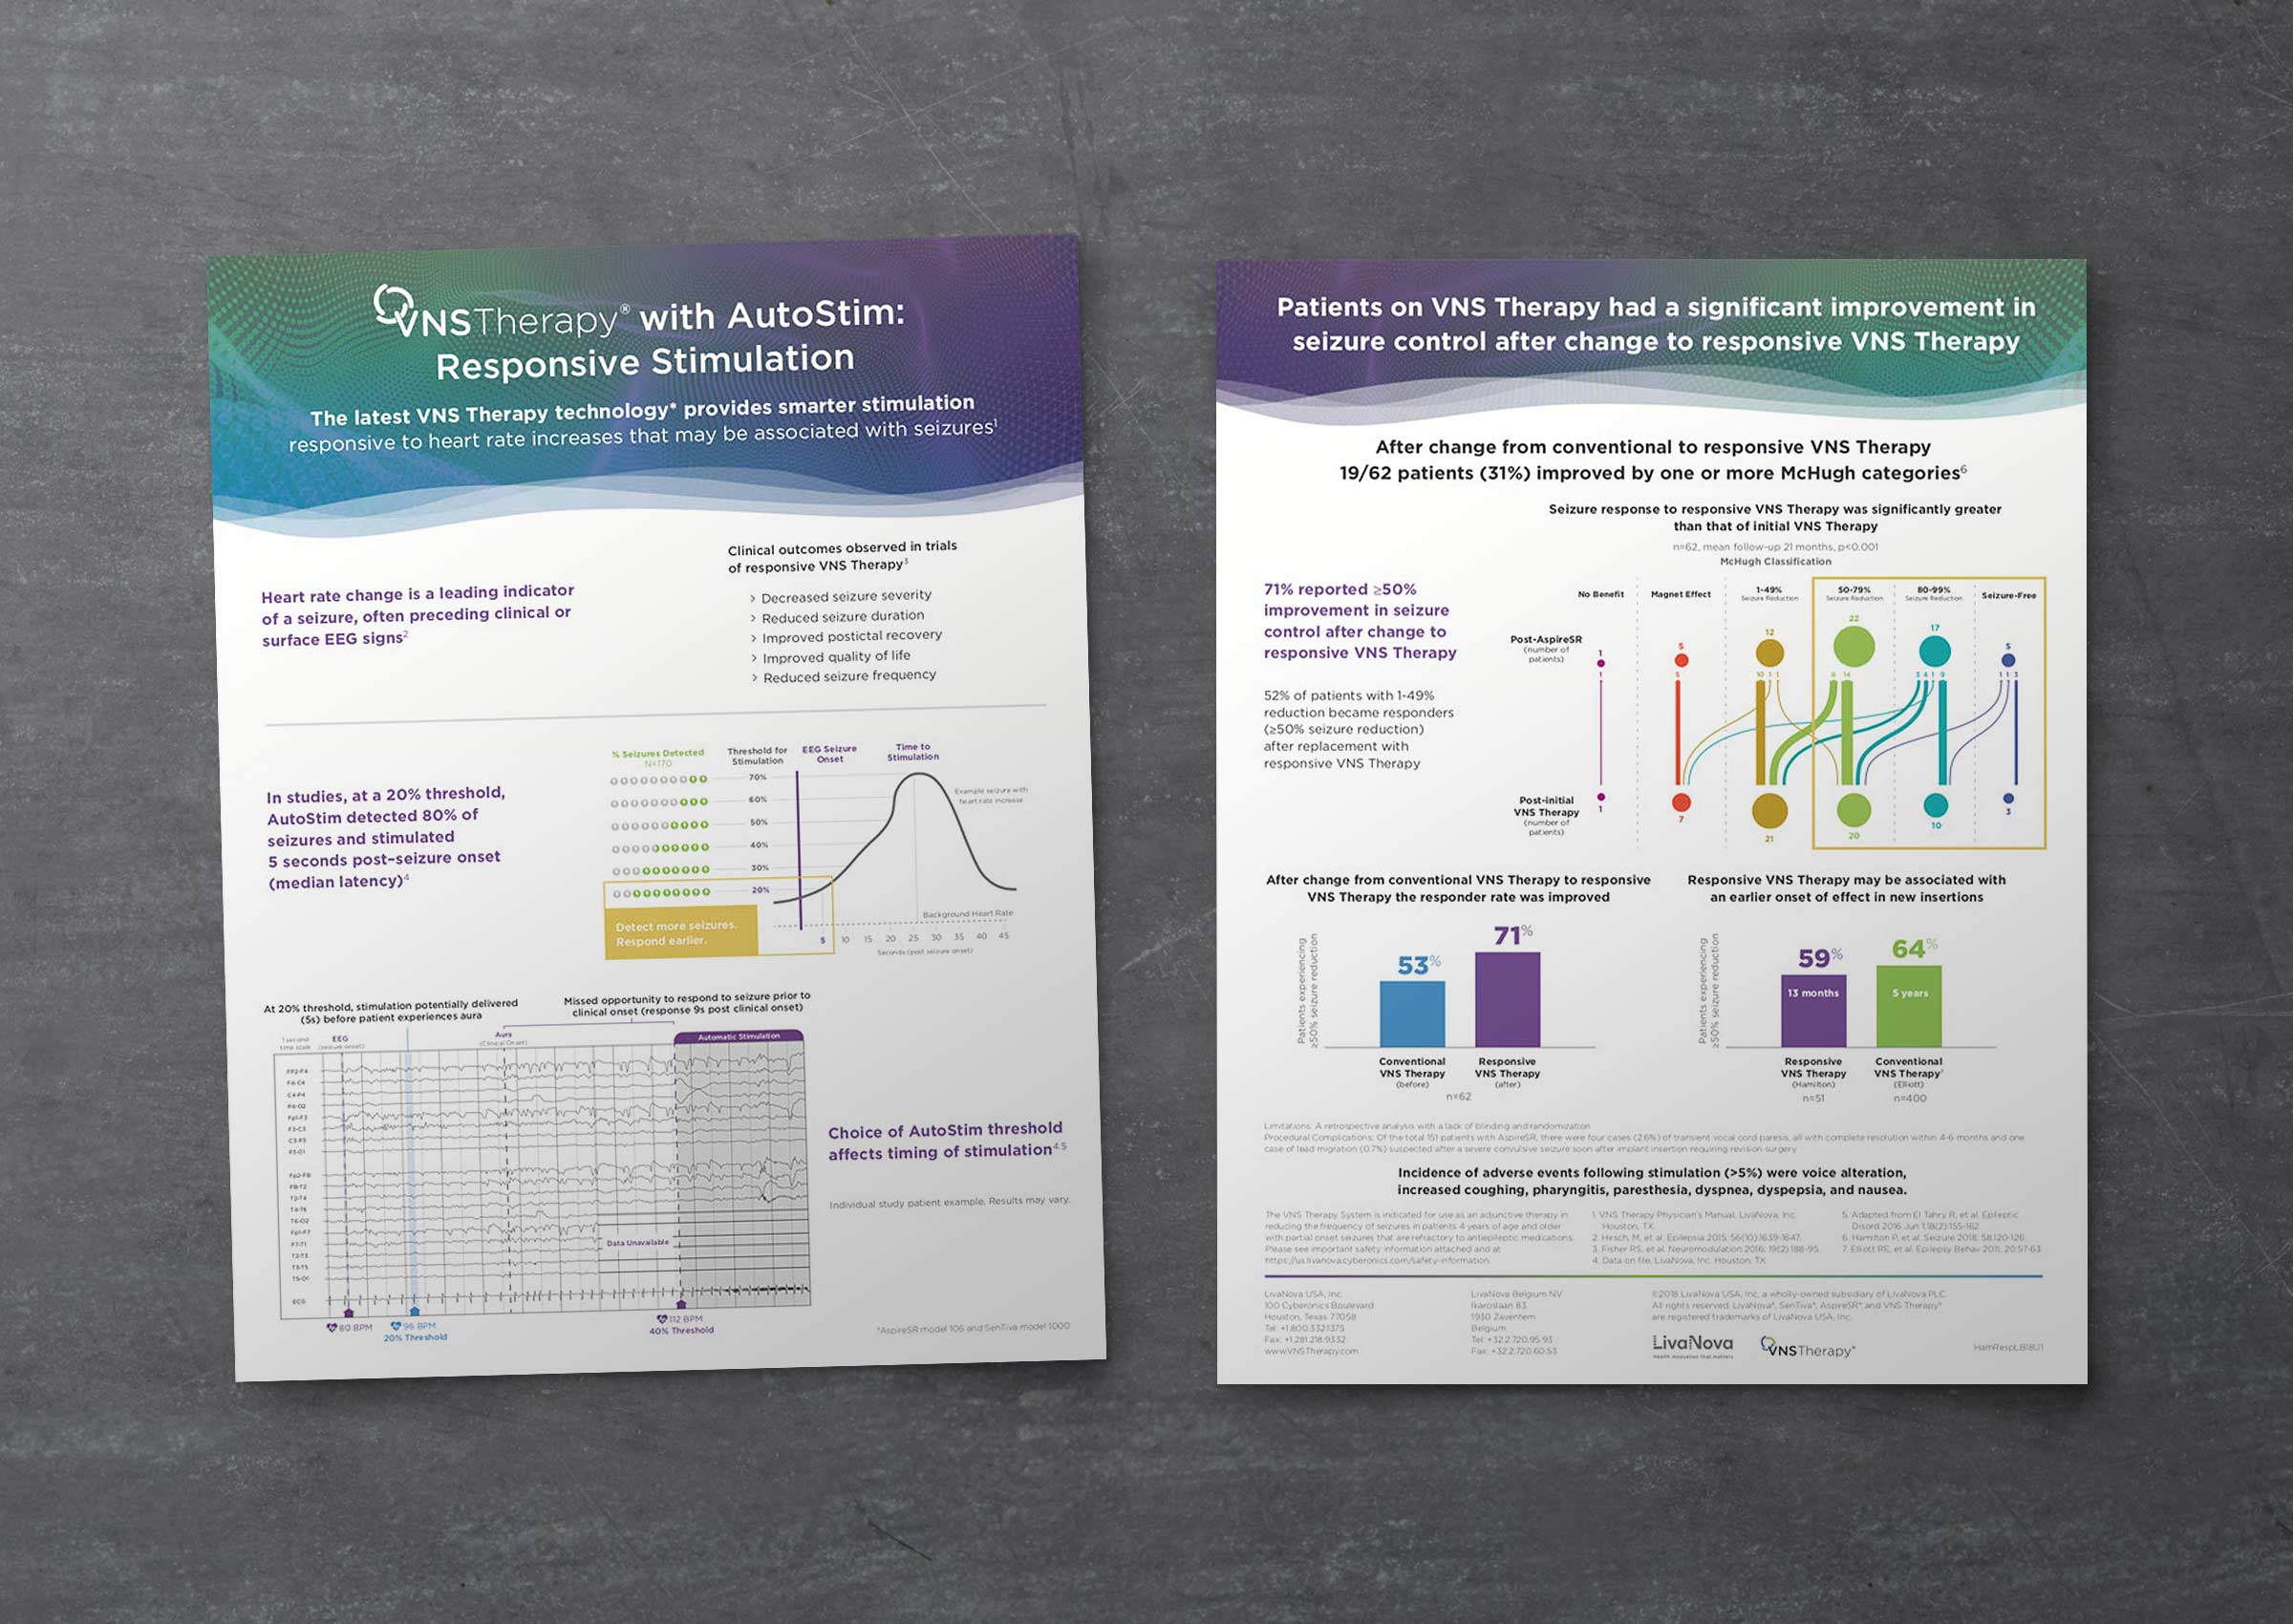
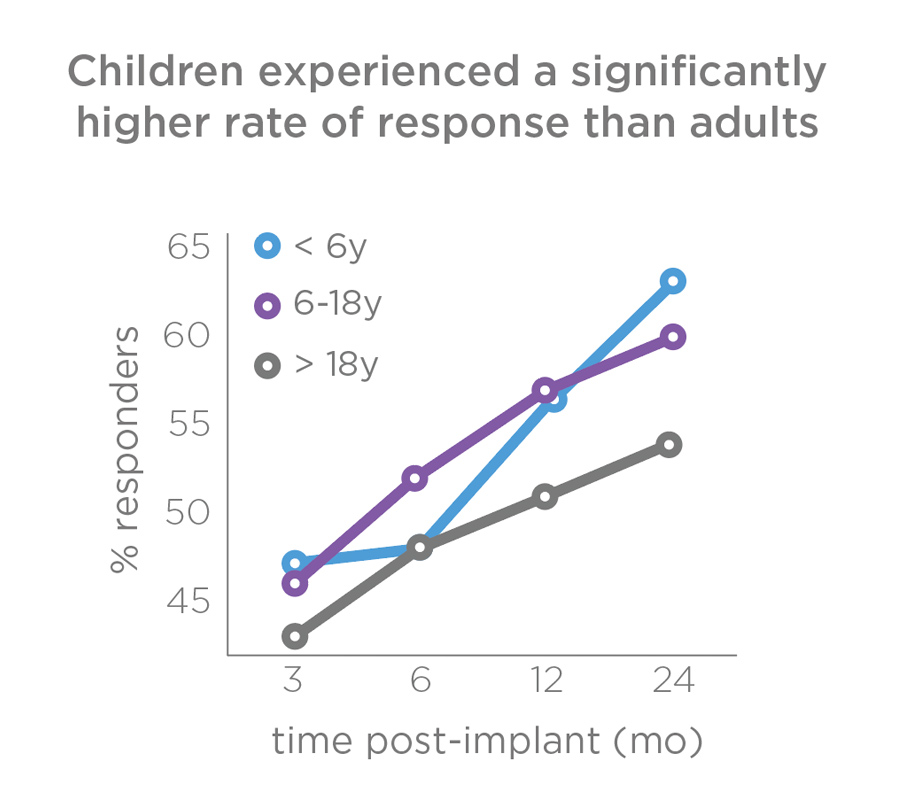
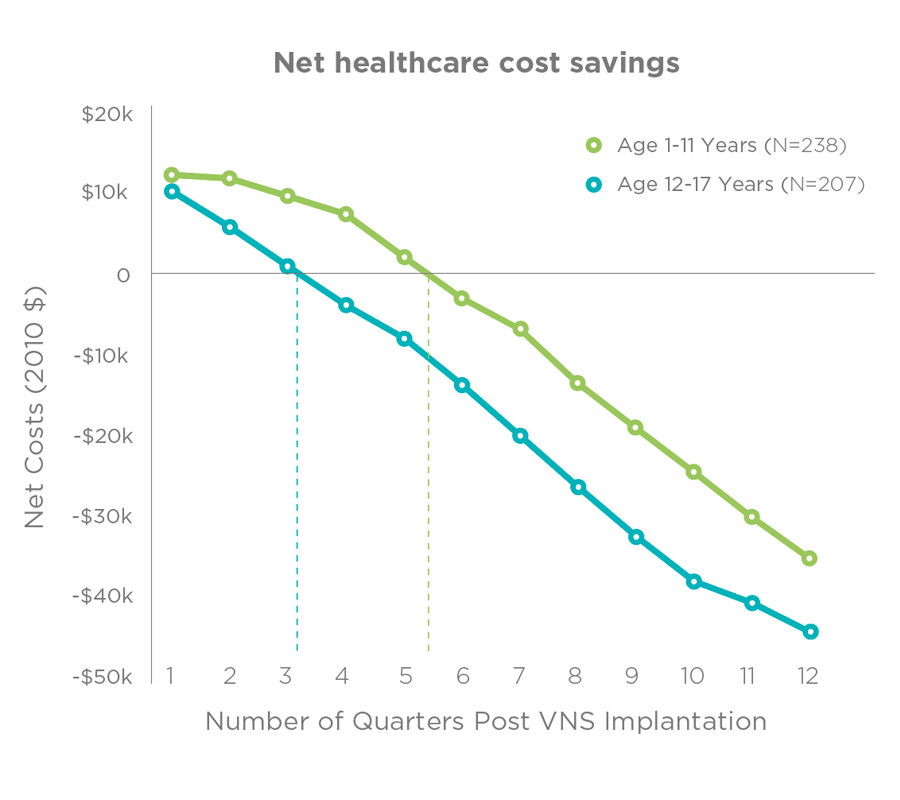
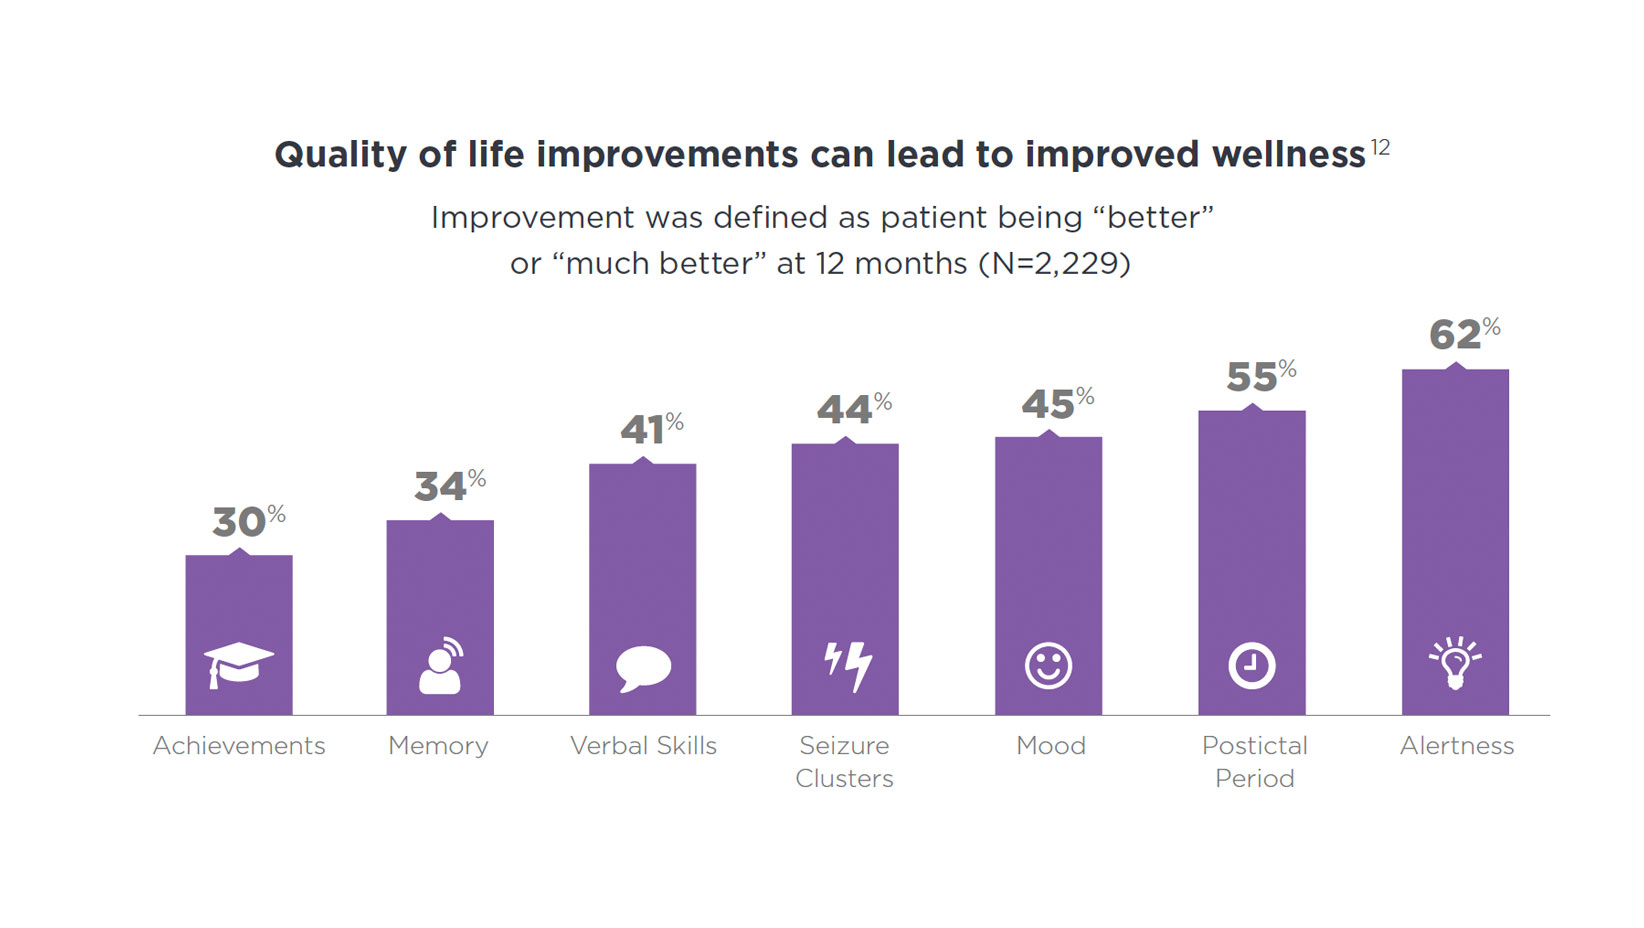
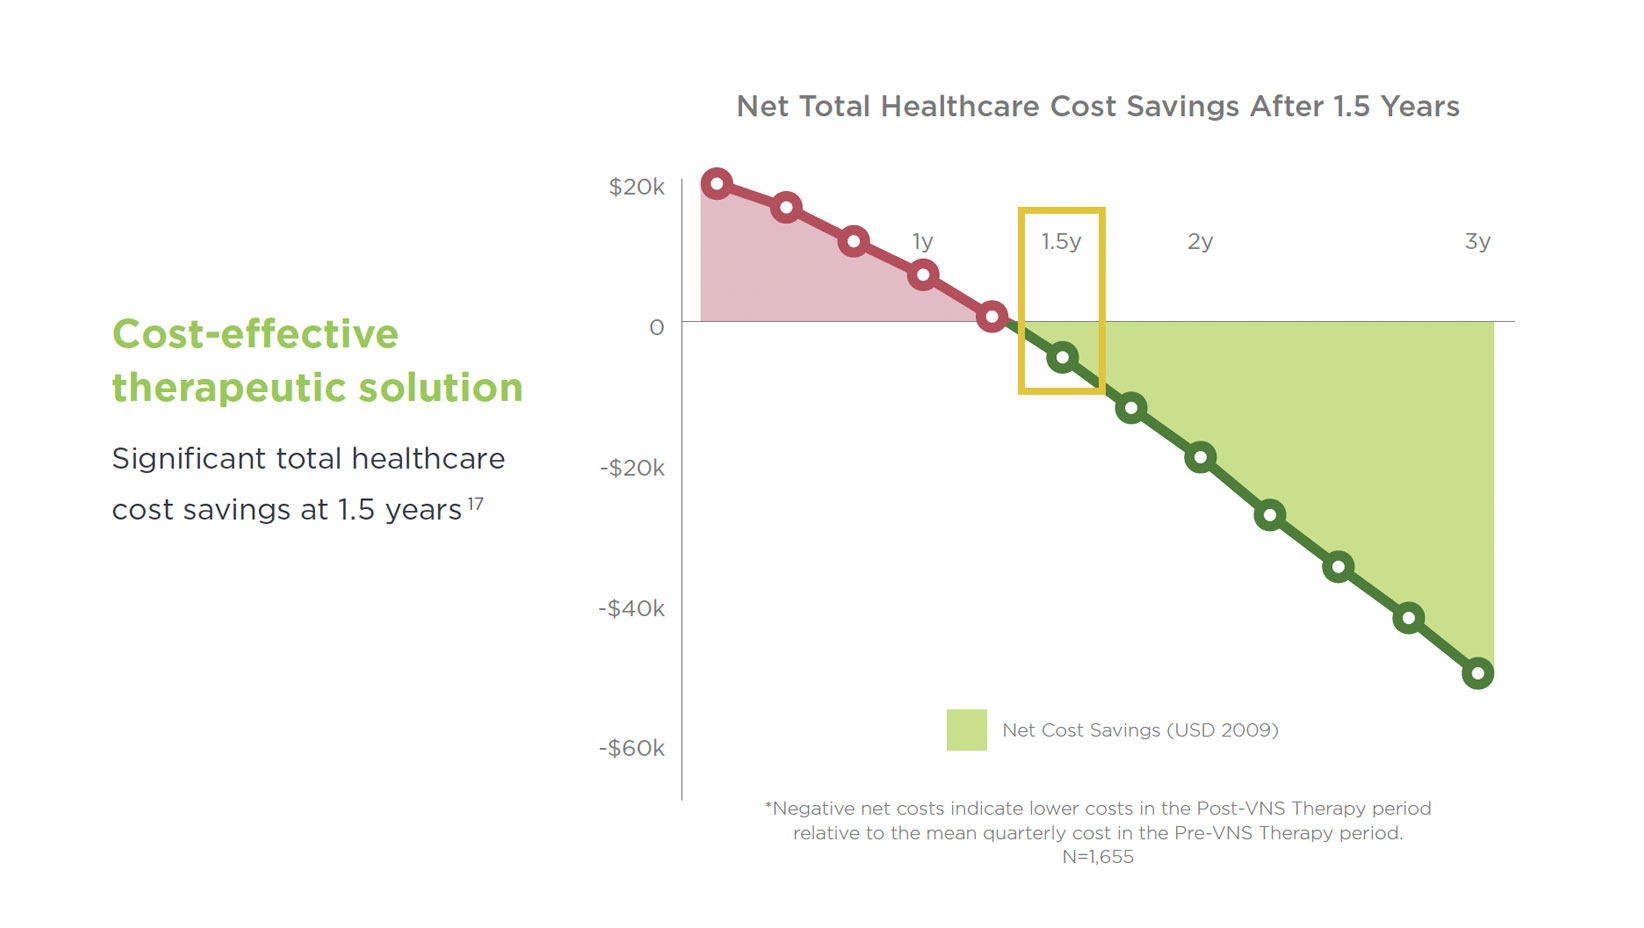
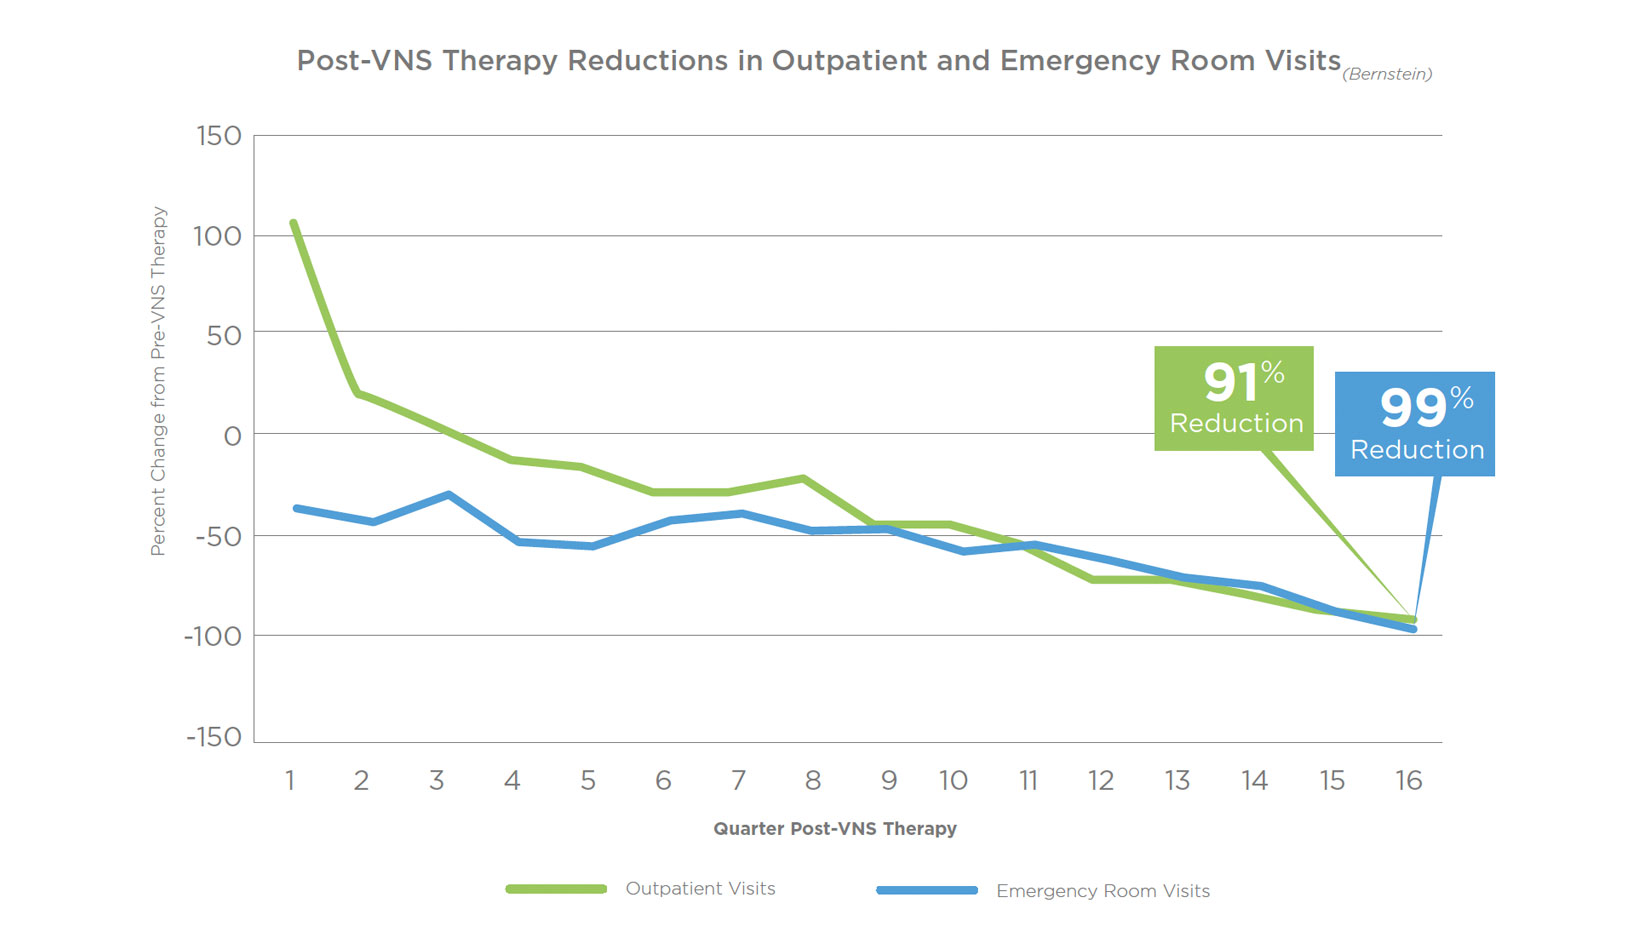
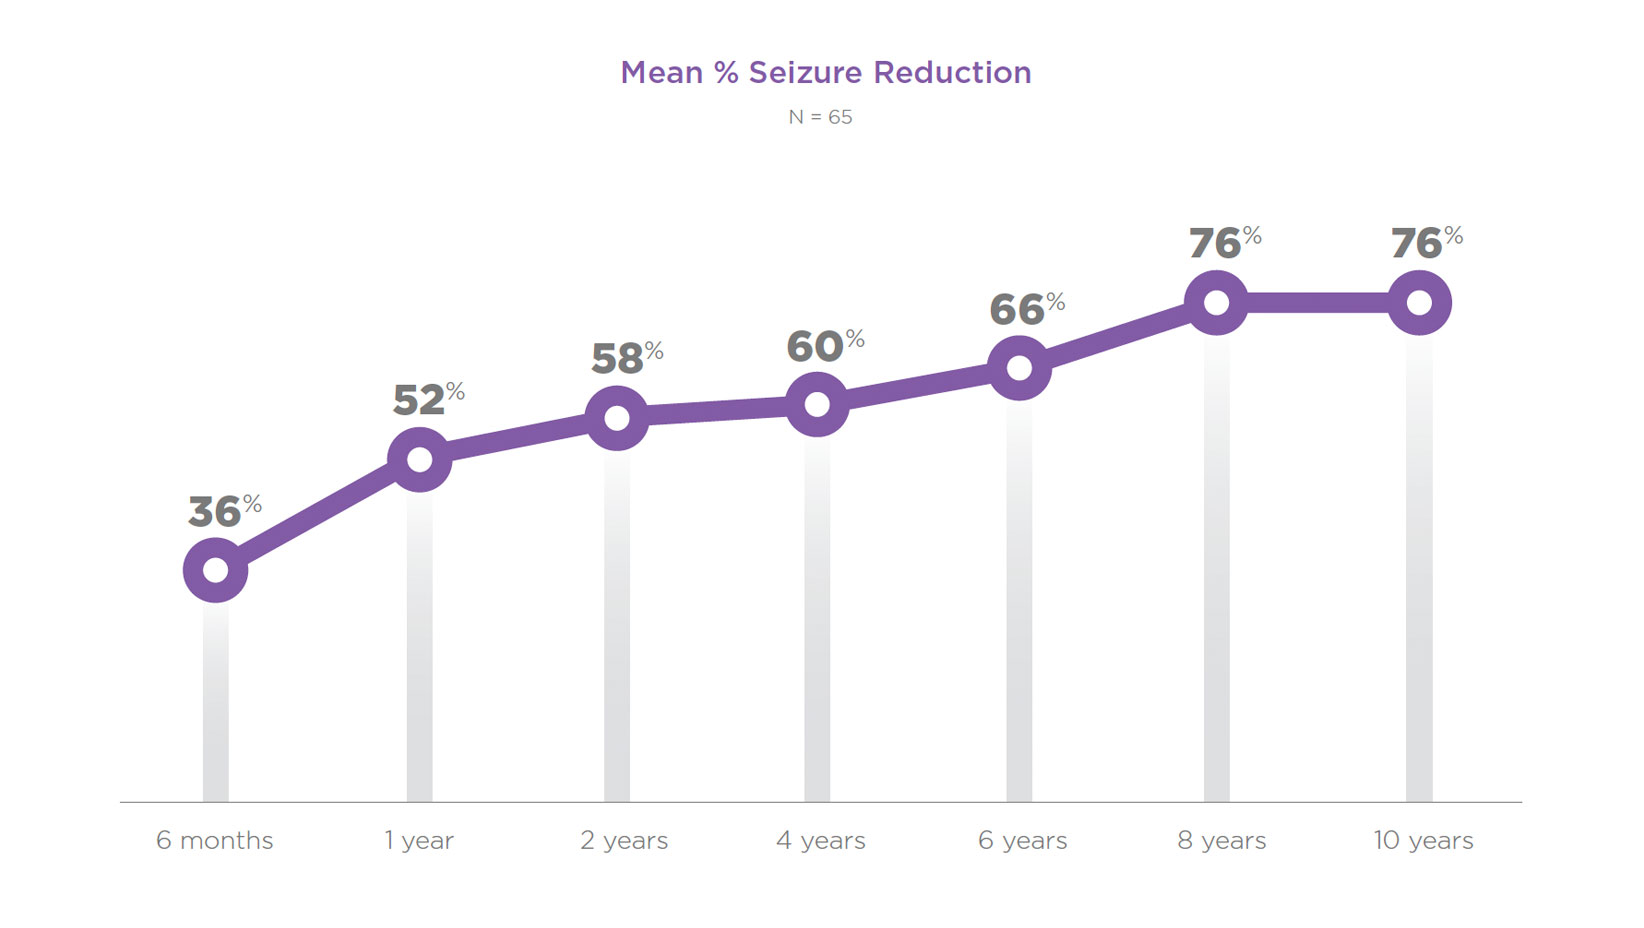
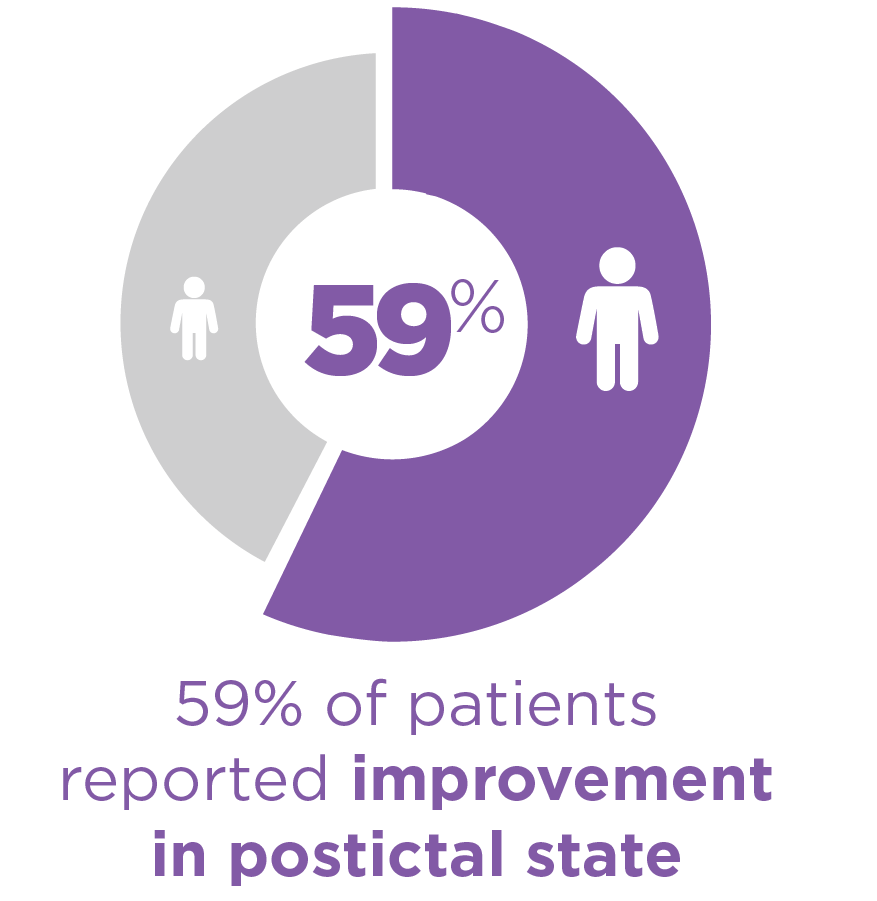
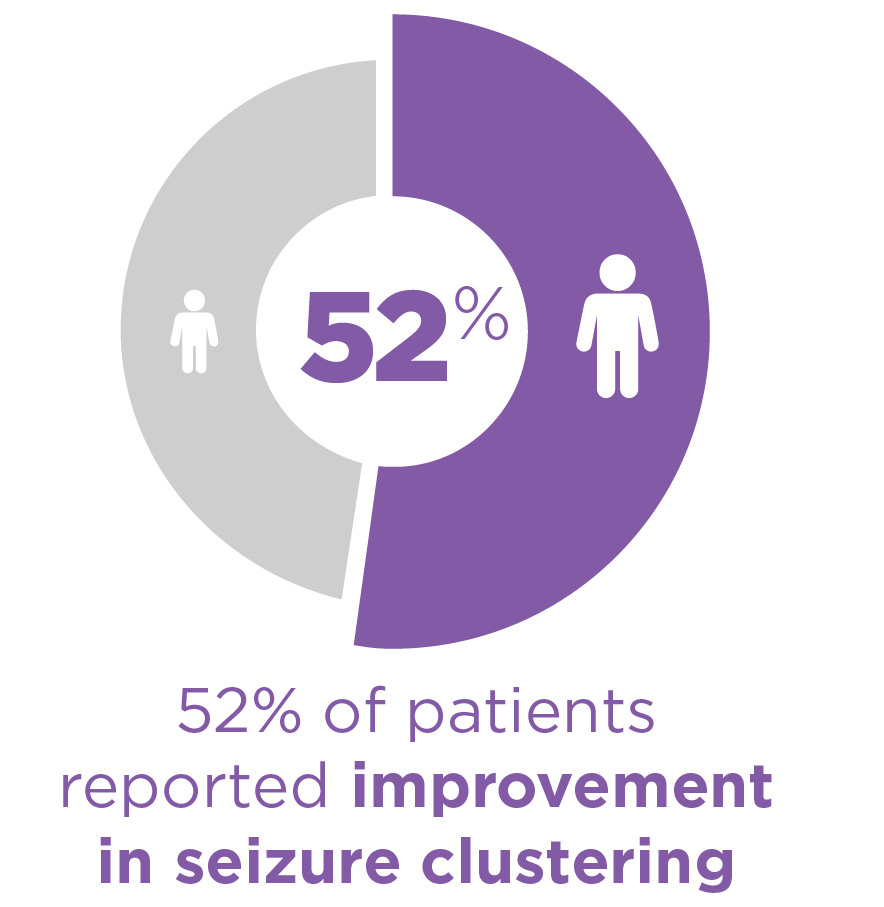
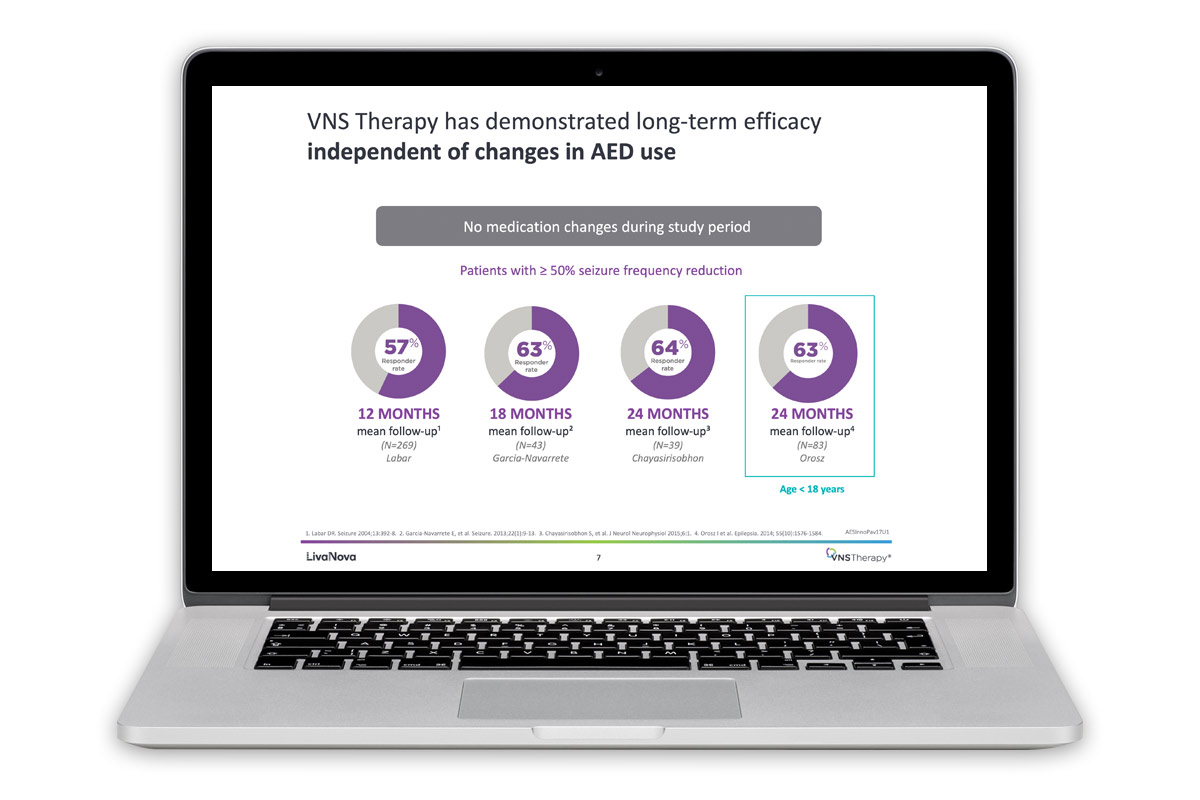
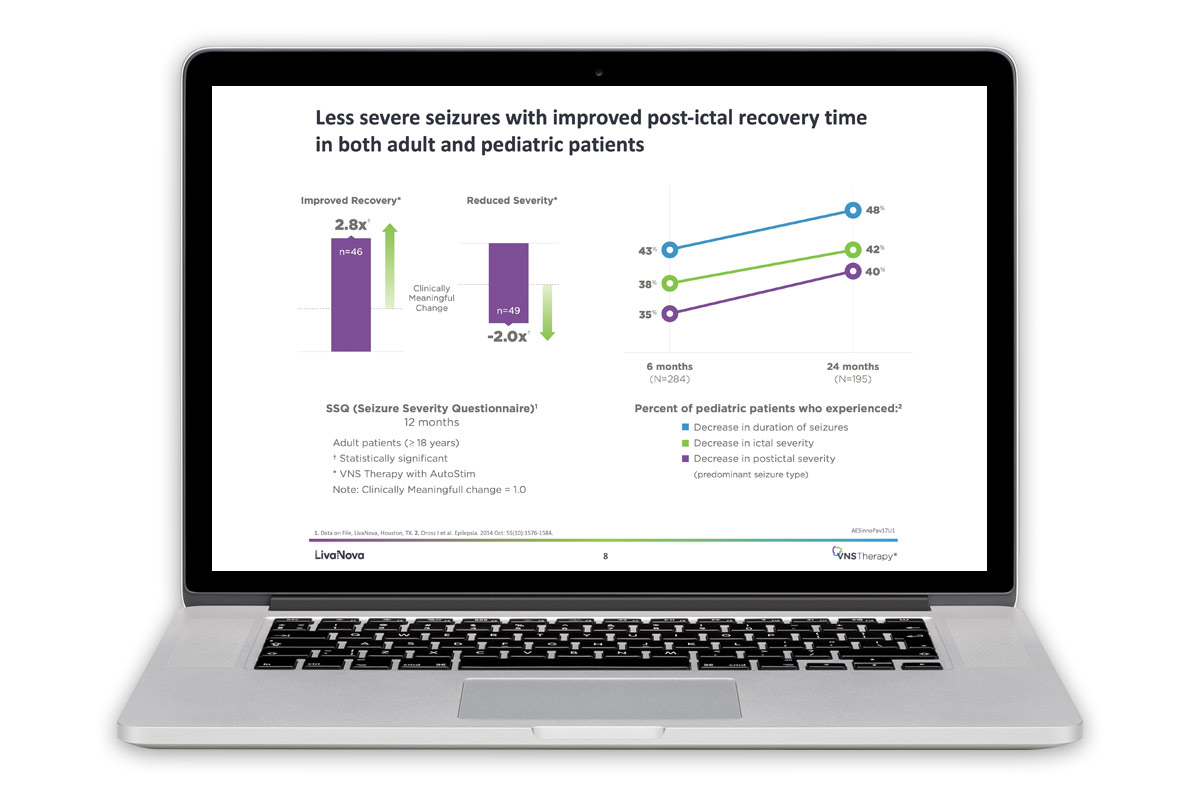
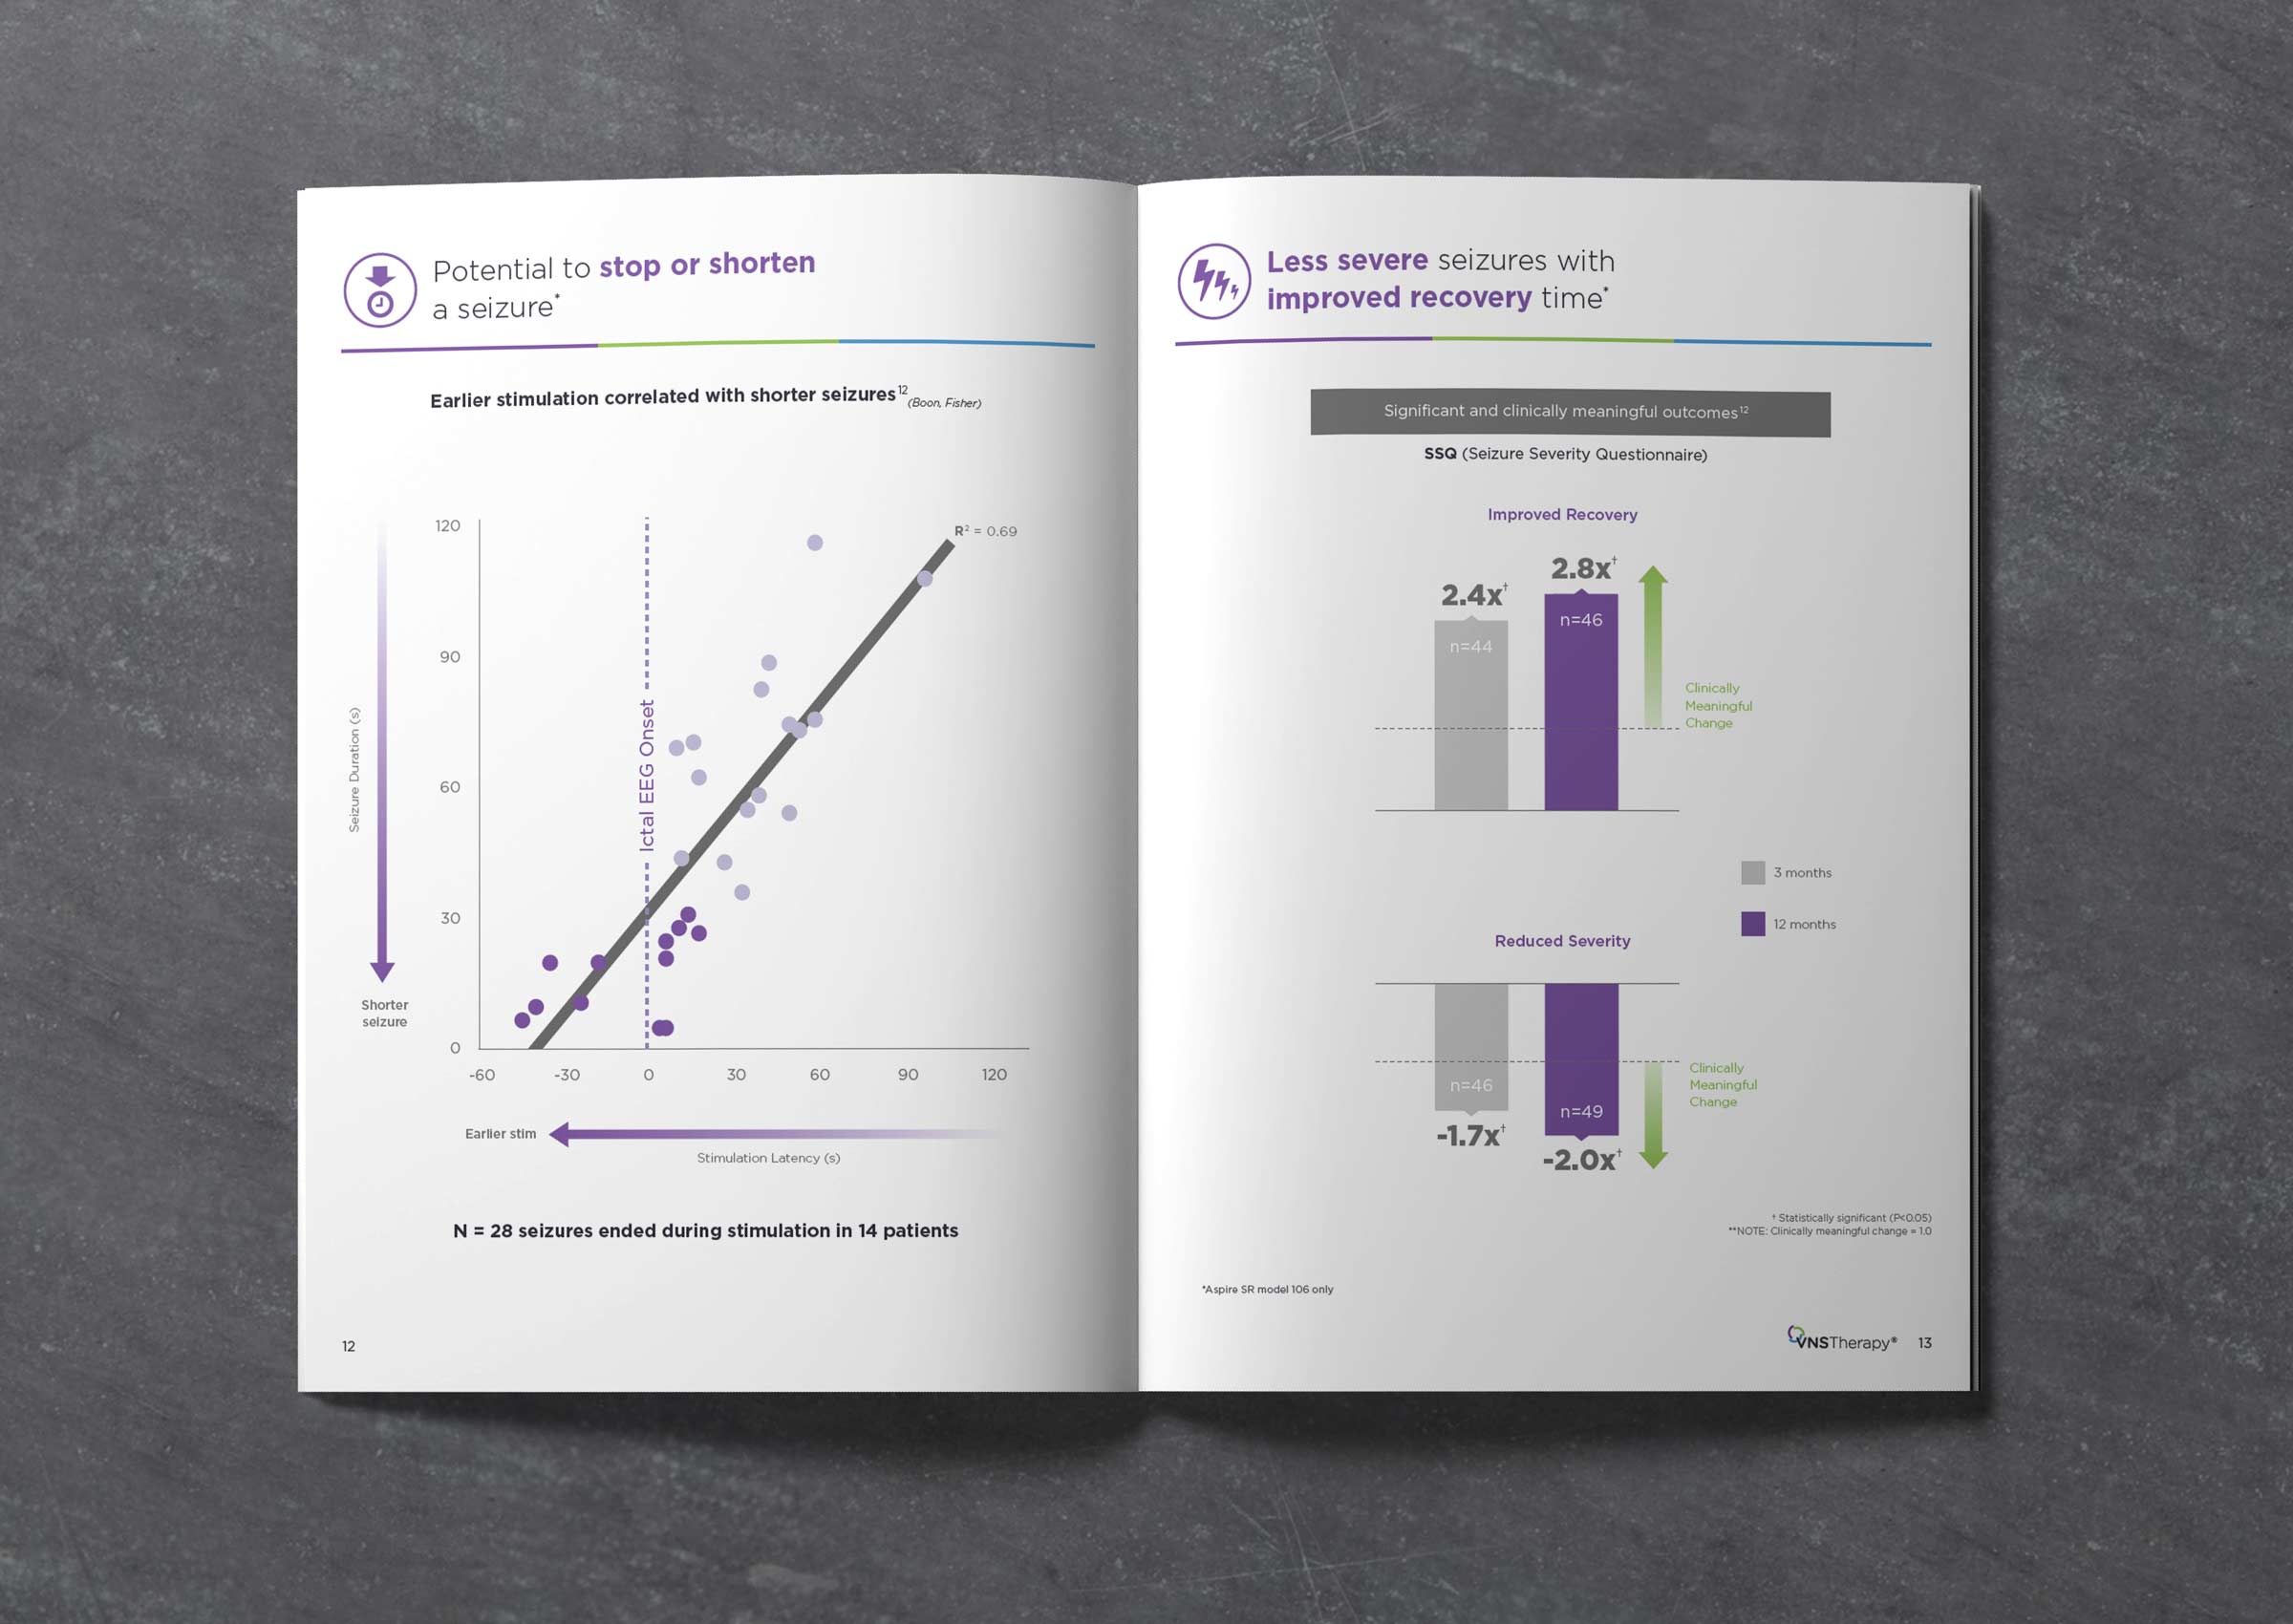
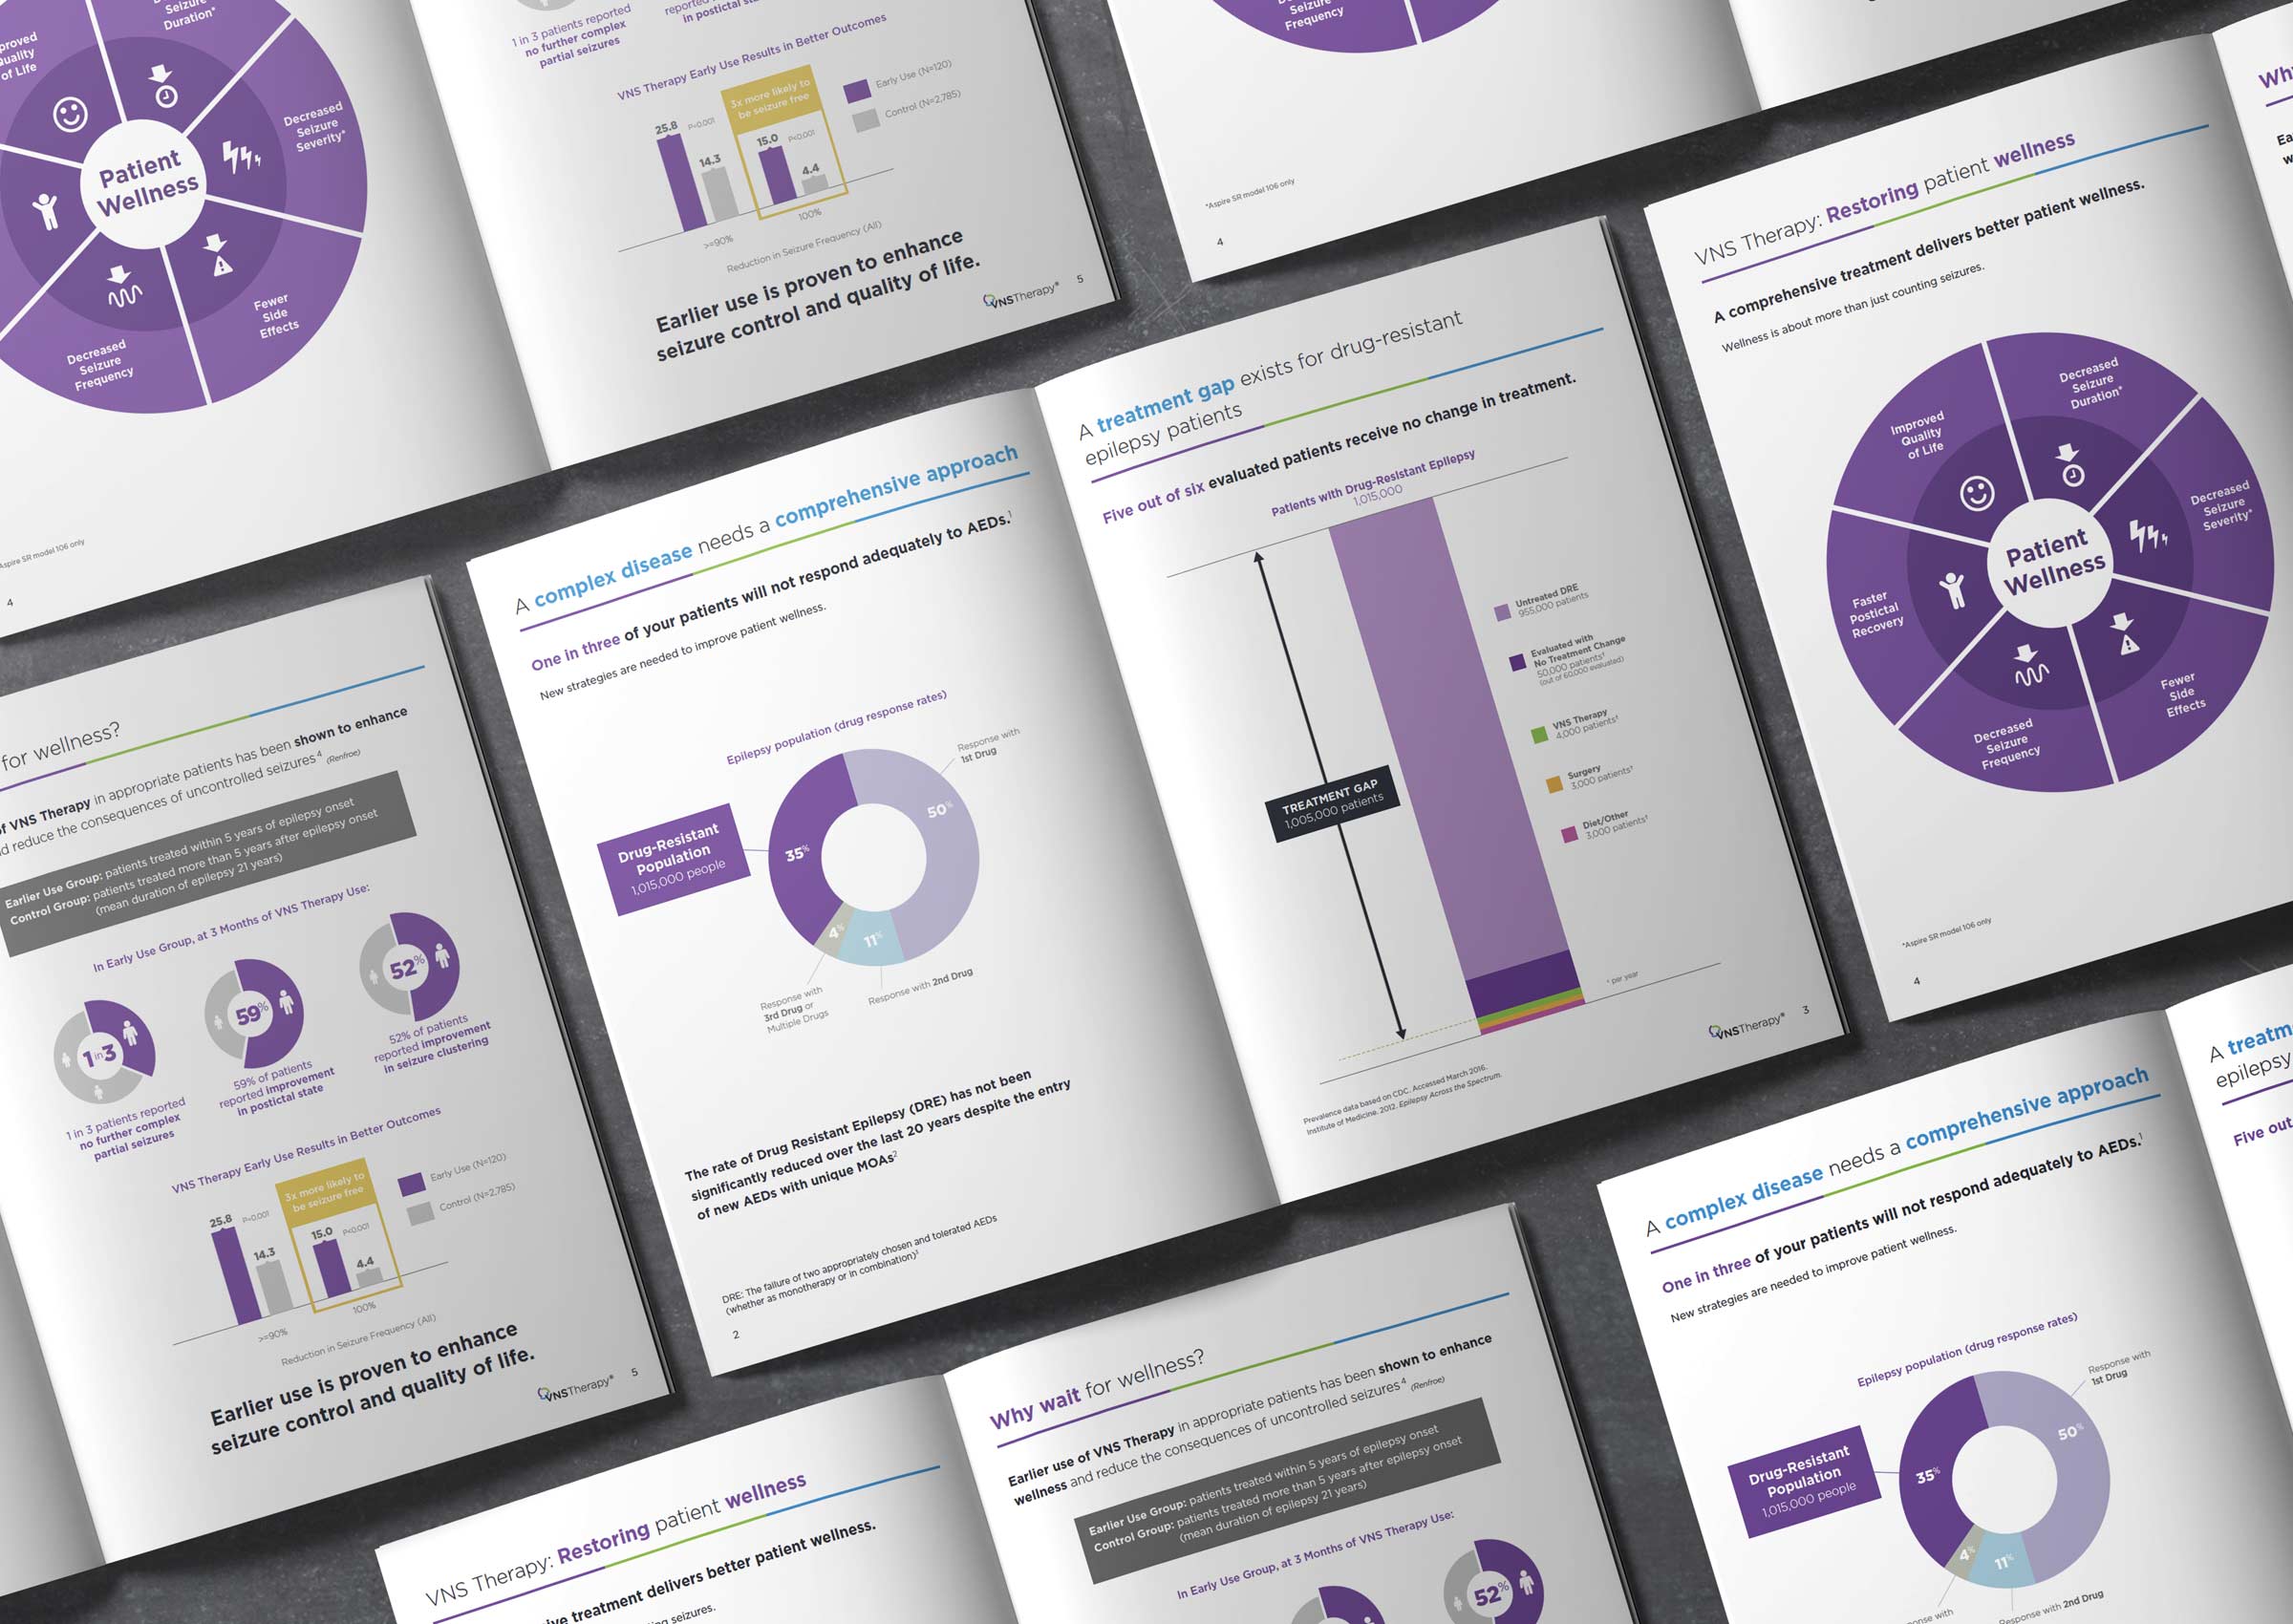
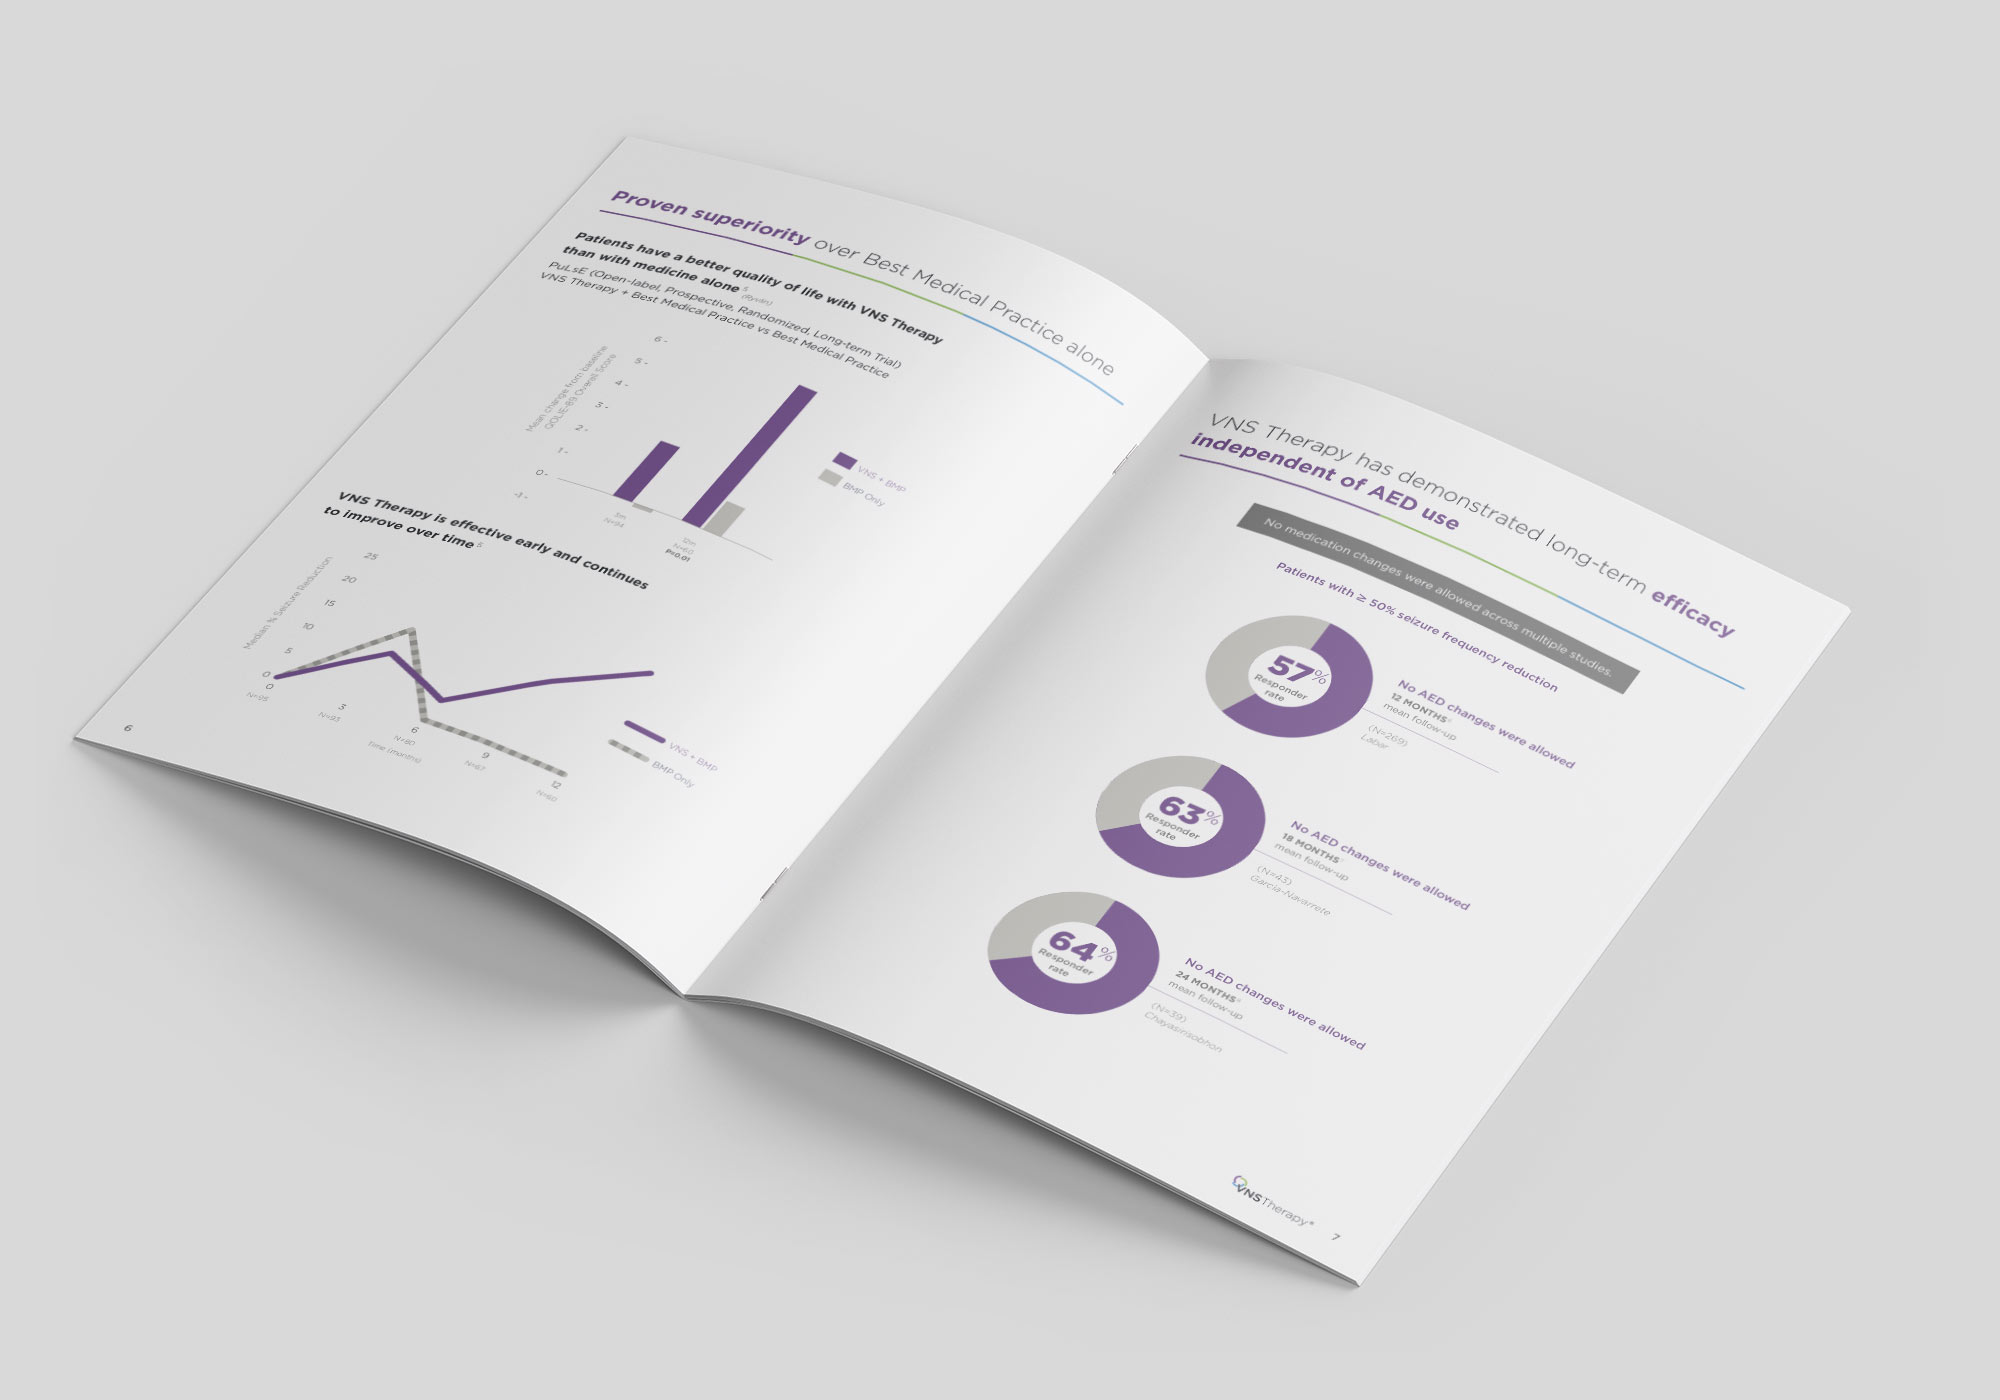
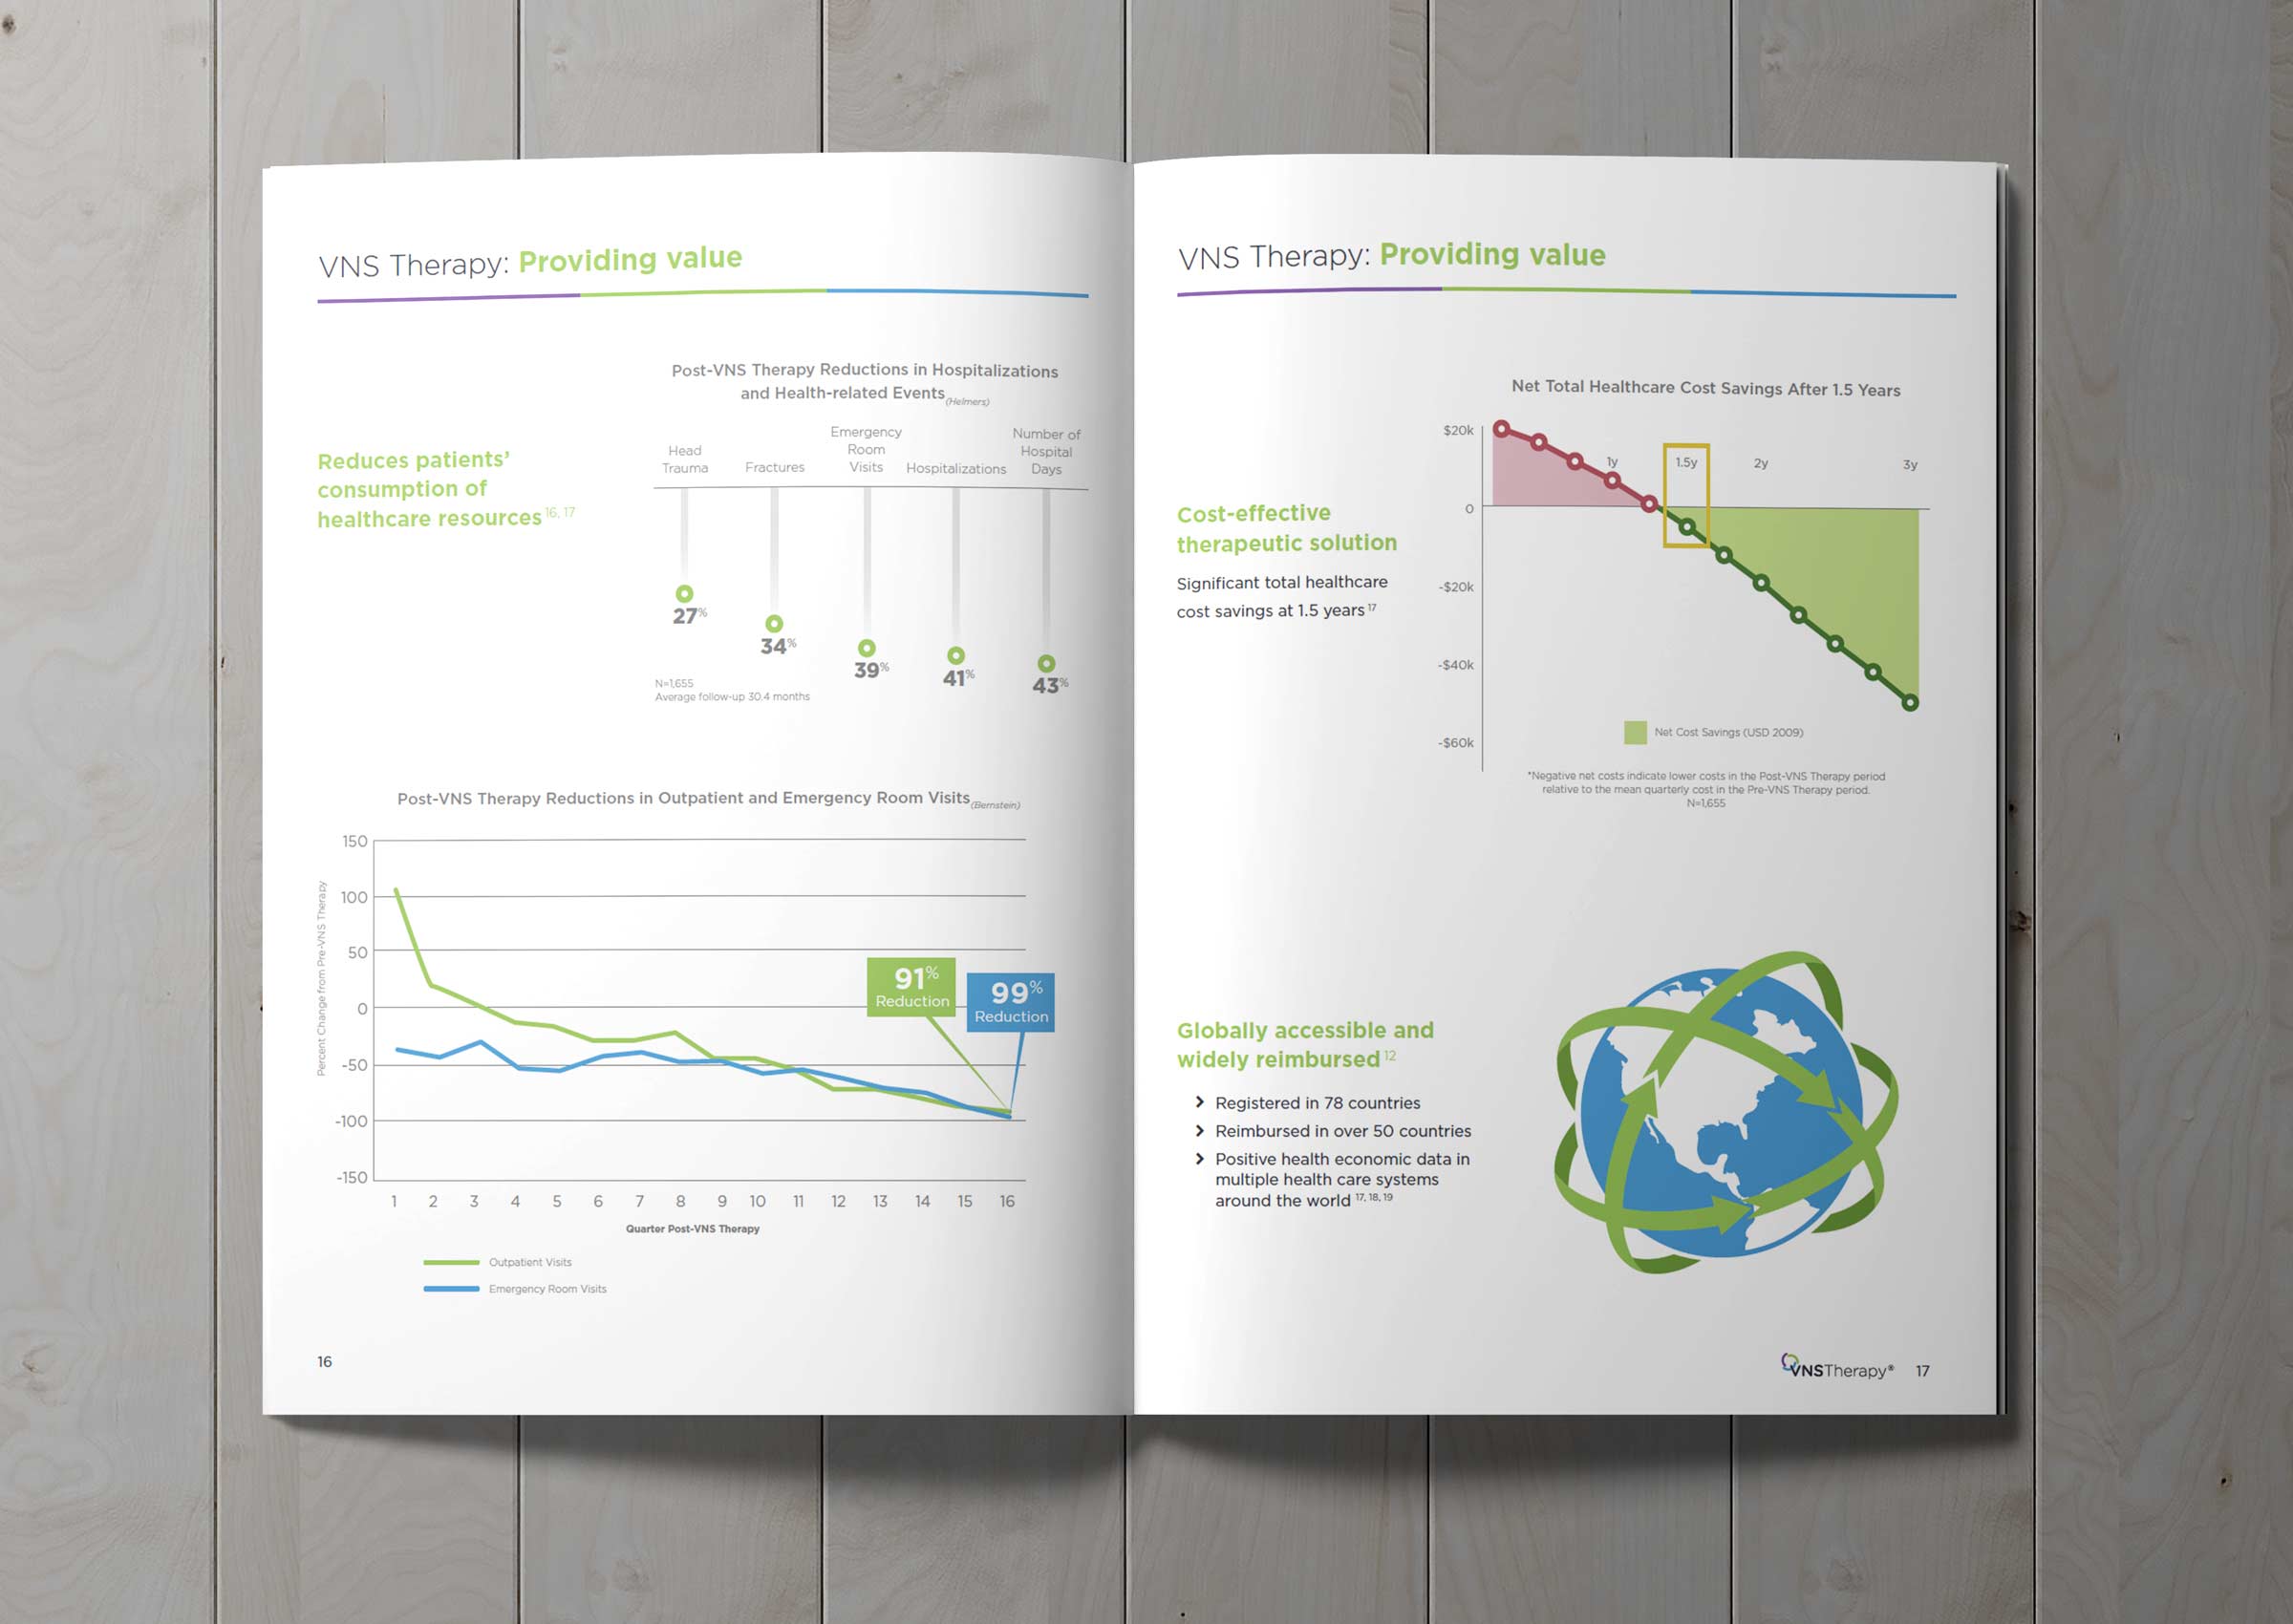
A core tenet of the advertising position for VNS Therapy was the presentation of data. Using information derived from scientific studies and patient surveys, I collaborated with the marketing team to develop branded, easy-to-understand graphs and charts. We then added these to a multi-pronged advertising effort that included print brochures, social media graphics, medical conference booths, and more.


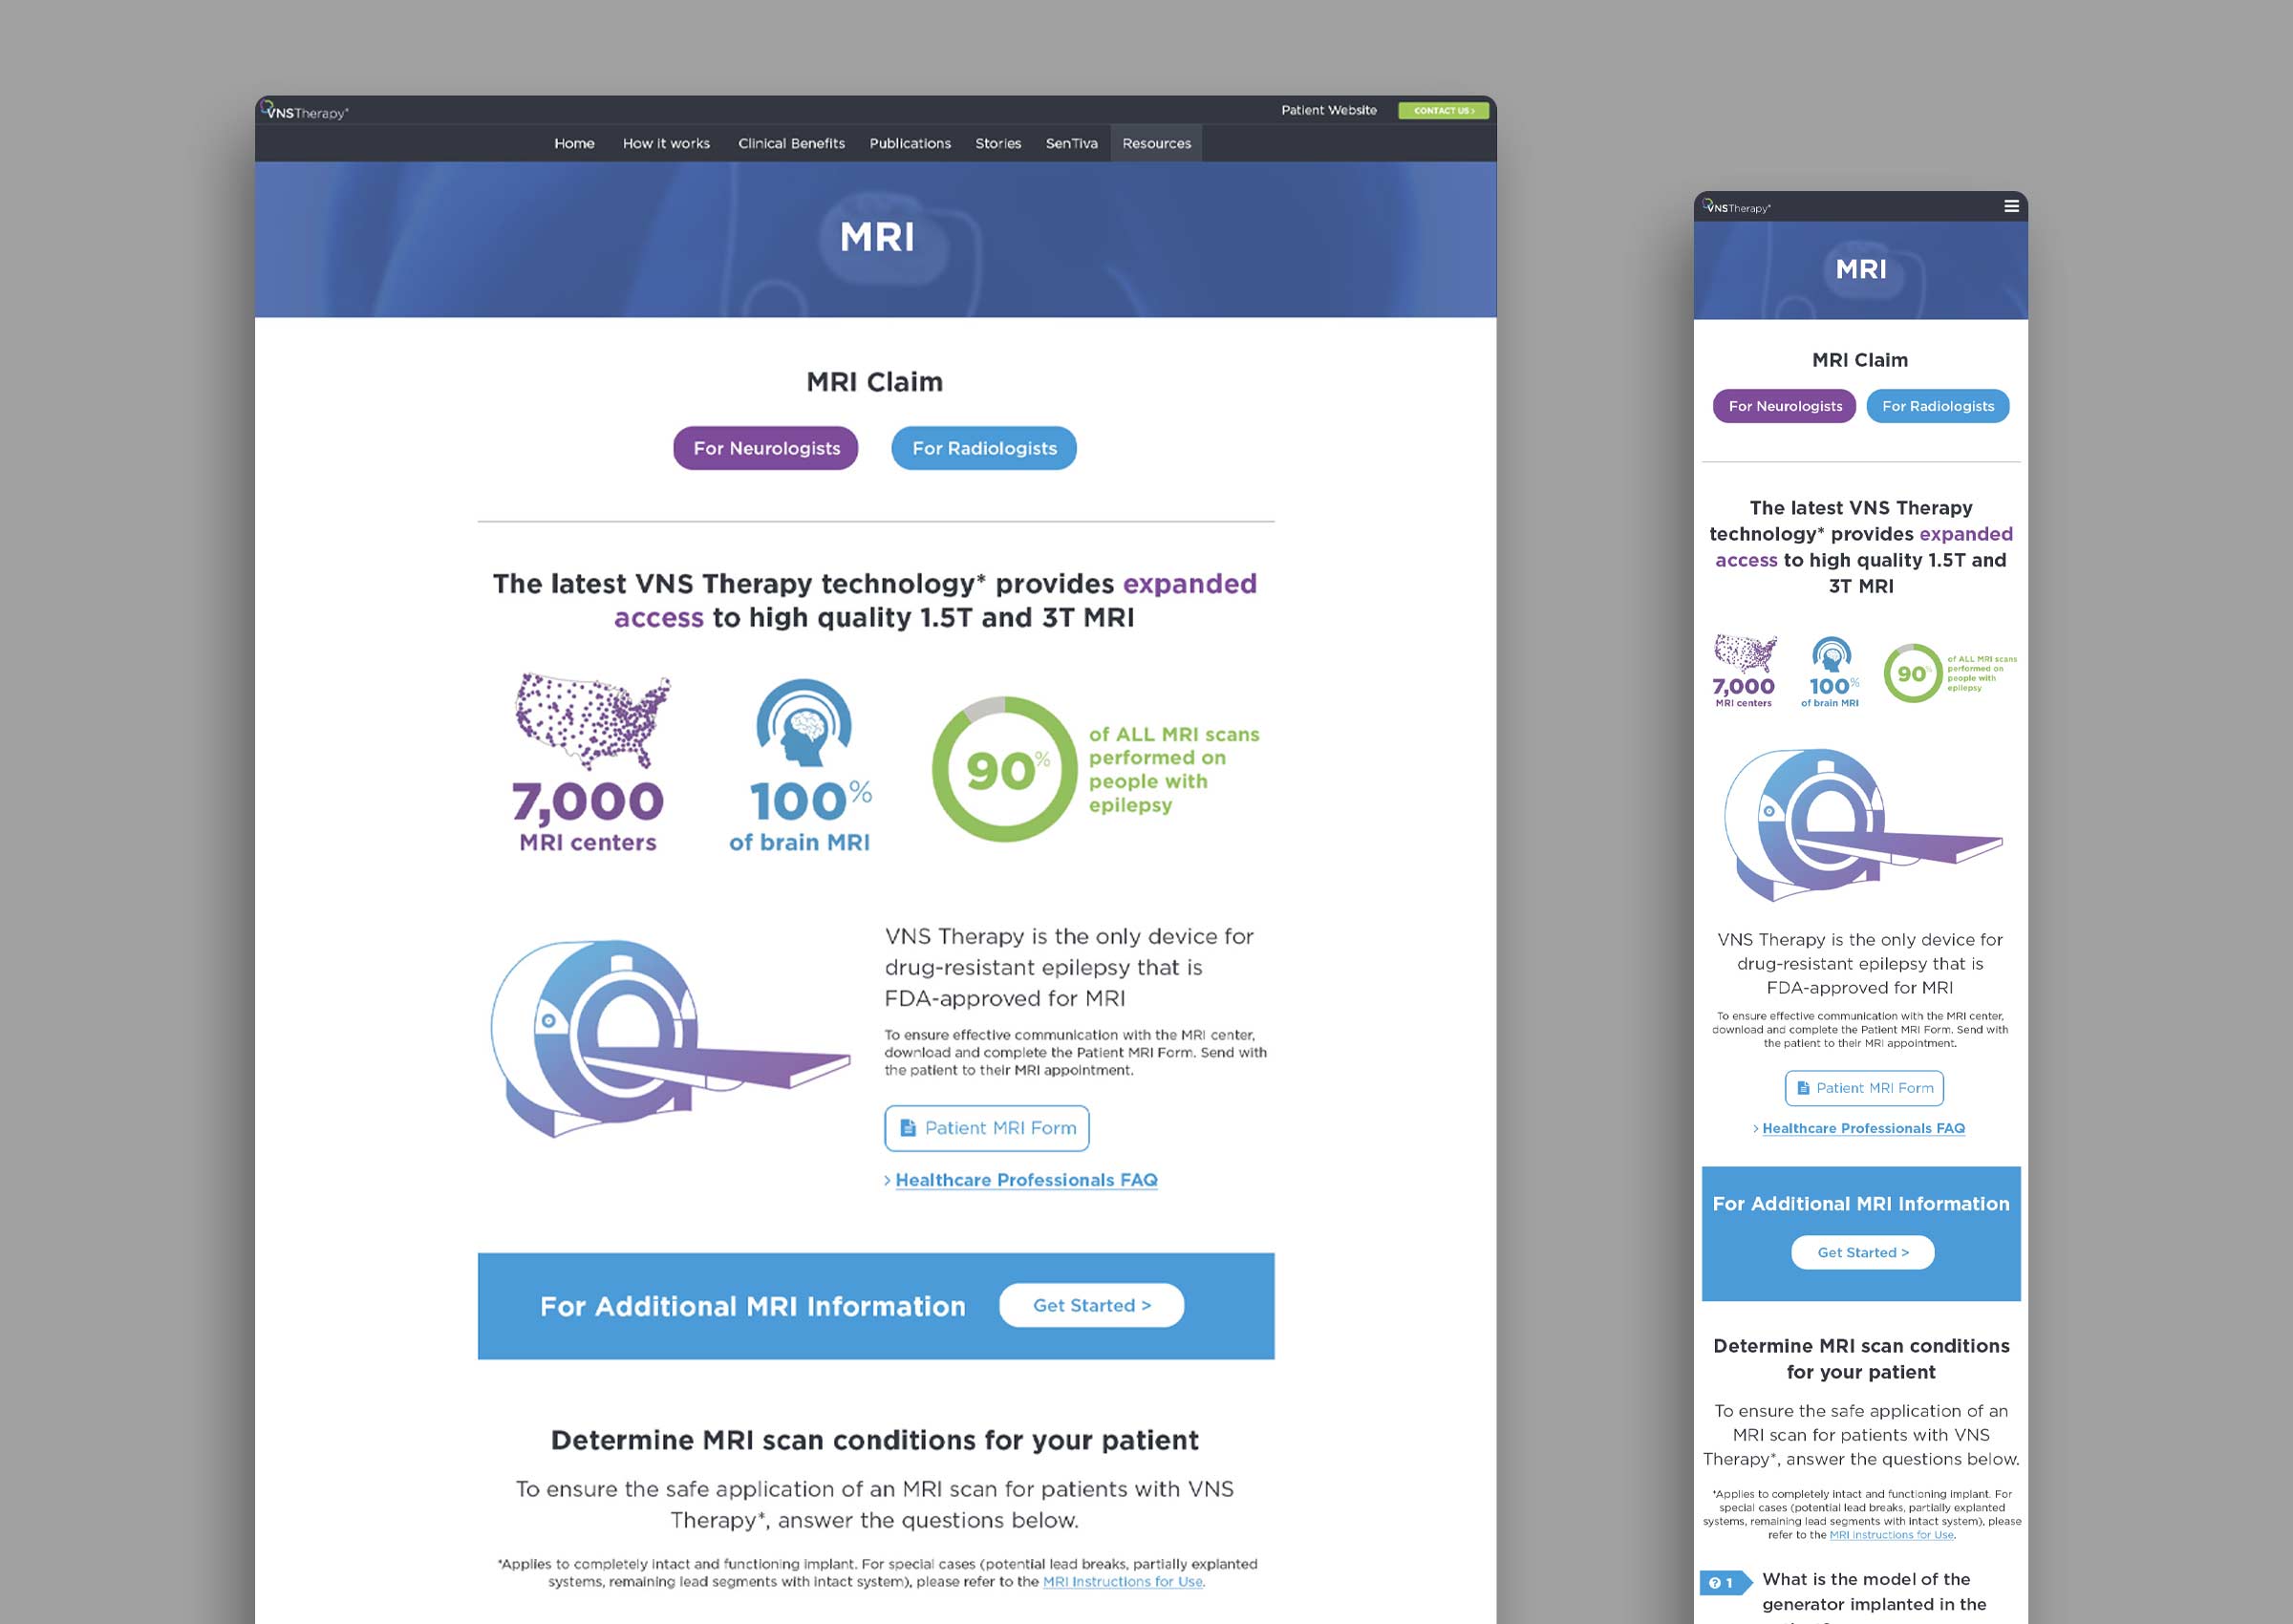

Medical Device Diagrams


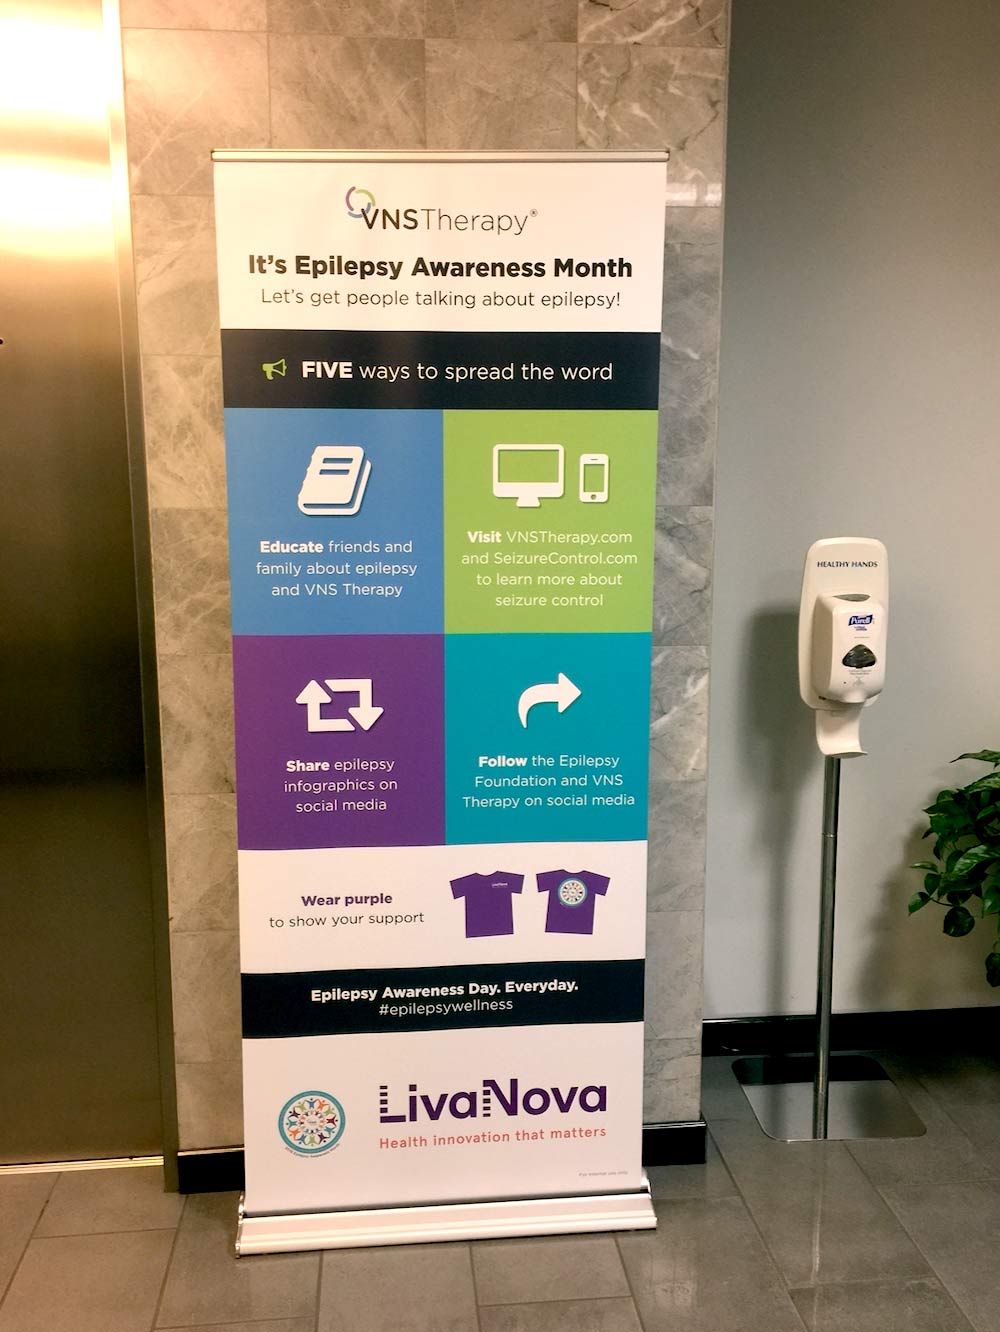
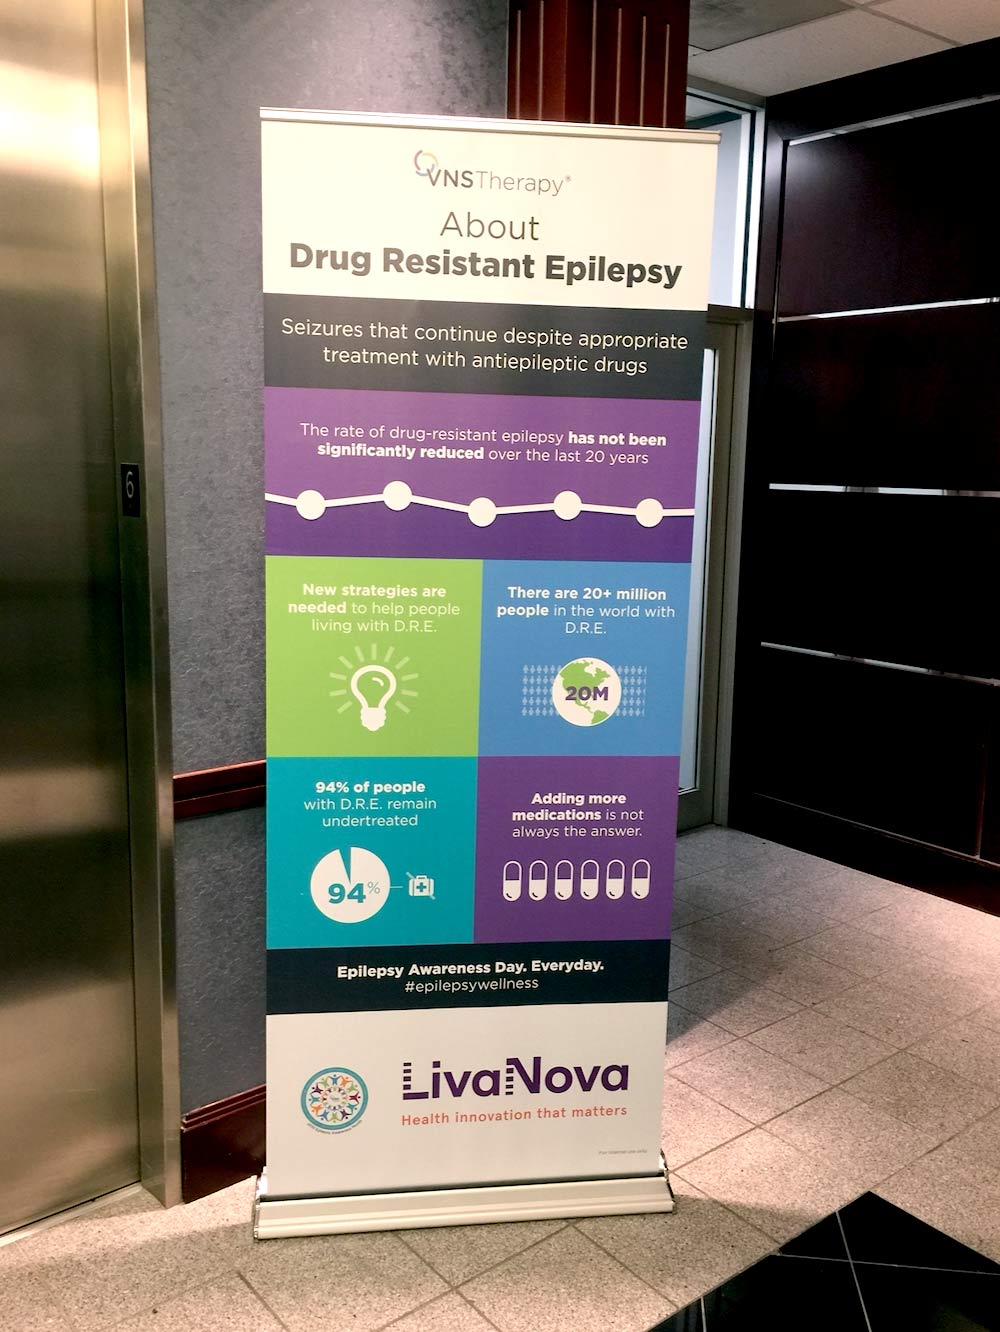
Epilepsy Awareness Month
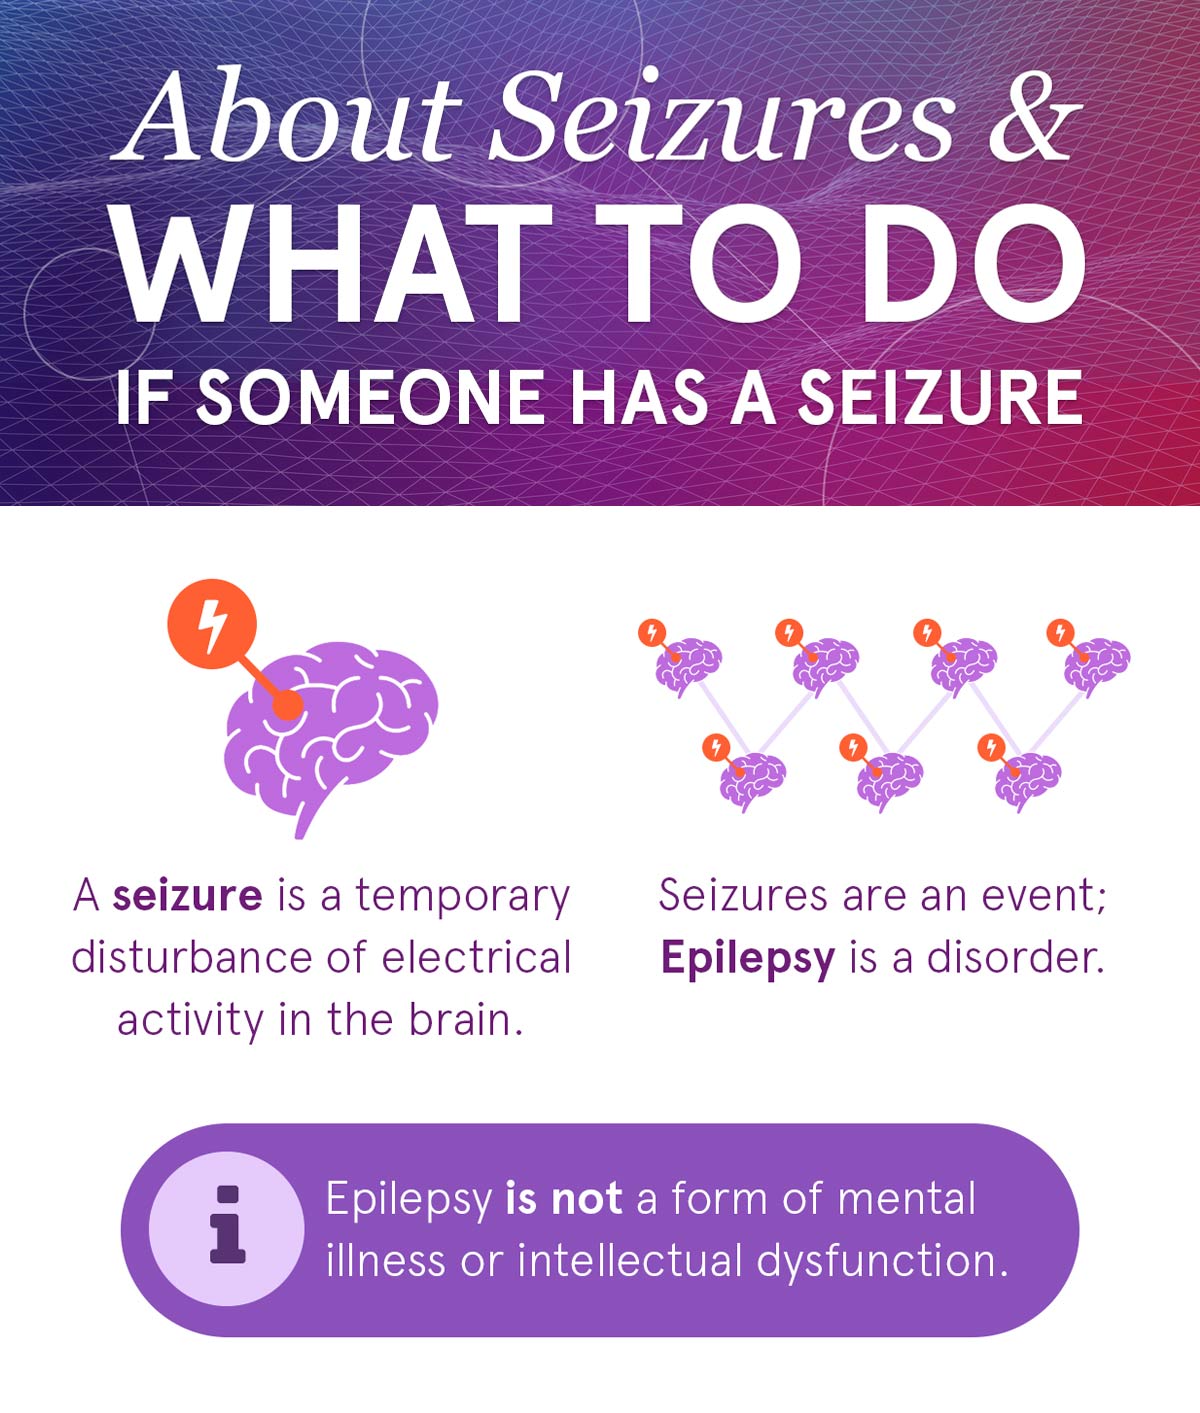
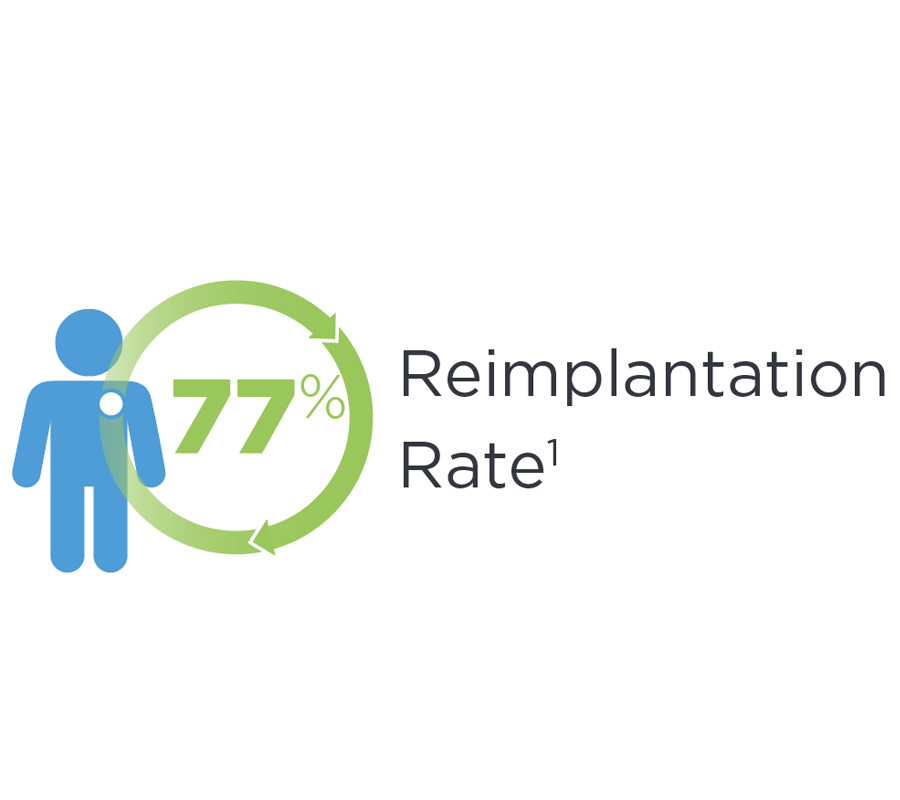
Every November, LivaNova would produce informational materials regarding the disease state of epilepsy. This was more of a public outreach exercise, rather than direct advertising. The infographics I designed were applied to signage, emails, and social media posts.